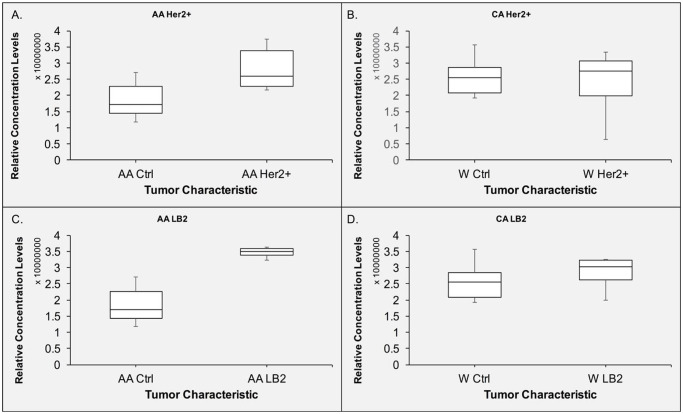
Fig 3. Validation of RPPA data and assessment of racial disparities in serum concentration levels of vitronectin in Her2+ and LB2 tumor subtypes.
The data above is validation of data shown in Fig 2, that showed potential racial disparities in tumor subtypes in vitronectin concentration levels of serum. A. Displays the relative concentration levels of vitronectin in AA Her2+ patients in serum compared with corresponding control samples. B. Relative serum concentration levels of vitronectin in WA Her2+ patients and compared with healthy patients C. Displays the relative serum concentration levels of vitronectin in AA LB2 patients and control serum. D. Displays the relative concentration levels of vitronectin in CA LB2 patients in serum.

