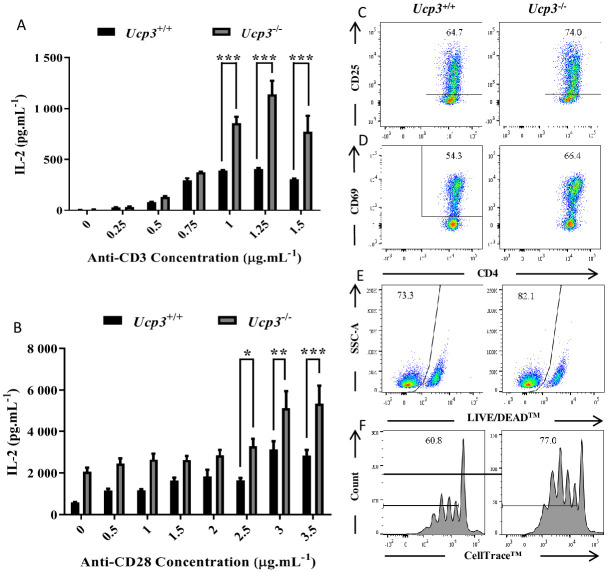
Fig 3. Primary activation of Ucp3-/- Th0 cells is altered compared to that of Ucp3+/+ Th0 cells.
Purified naive CD4+ T cells isolated from Ucp3+/+ and Ucp3-/- mice were activated in the presence of increasing concentrations of anti-CD3 (A), increasing concentrations of anti-CD28 in the presence of 1 μg.mL-1 of anti-CD3 (B). Levels of IL-2 secretion by Th0 cells after 24 h activation as determined by ELISA of Th0 cells. Data were analysed using a two-way ANOVA with a post hoc Bonferroni test to quantify significance where detected. * = p < 0.05. ** = p < 0.01. *** = p < 0.001. FACS analysis of (C) CD25 and (D) CD69 expression on Th0 cells at 24 h, and (E) viability at 24 h and (F) proliferation at 72 h post activation with 0.25 μg.mL-1 of anti-CD3. Dot plots and histograms are representative of at least three different experiments. Data were analysed using a two-tailed, unpaired t test to quantify significance where detected (* = p < 0.05). Flow cytometry data are presented as a percentage of the viable, CD4+ T cell population (C, D, F, G) or the total CD4+ T cell population (E).

