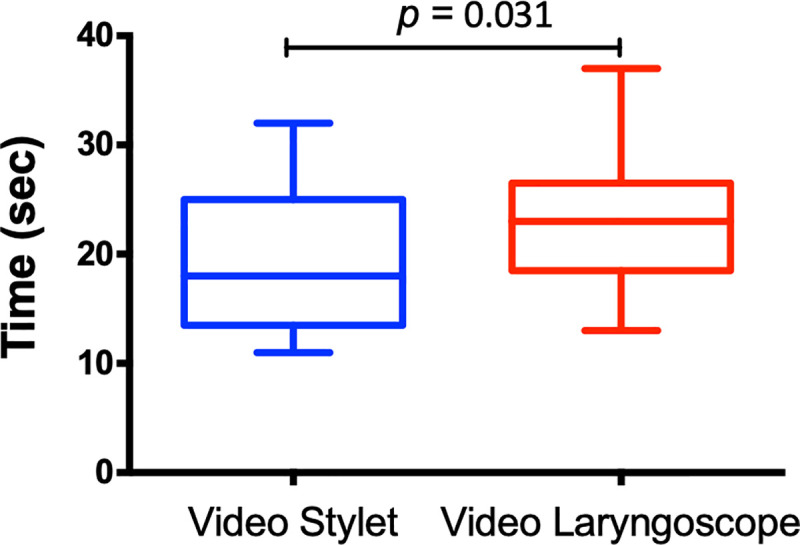
Fig 1. Total time to intubation in a simulated difficult airway (n = 21).

Boxes span the interquartile range; the line within each box denotes the median, and whiskers indicate the minimum and maximum values.

Boxes span the interquartile range; the line within each box denotes the median, and whiskers indicate the minimum and maximum values.