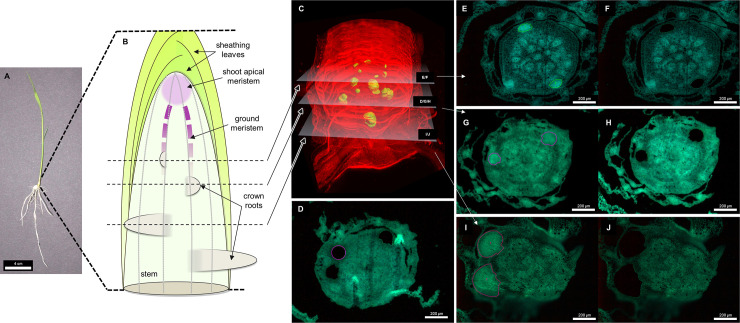
Fig 1. Visualization of the different developing crown root rings, and the delimitations of sampled tissues.
A: Picture of a rice plantlet used for this experiment and localization of the sampled area; B: Schematic representation of the stem base, crown root initiation area, and positioning of crown root rings; C: Result of 3D block reconstruction from biphoton microscopy of a whole stem base. Root primordia are identified in green, other tissues are in 3D transparency mode. White planes represent the relative positioning of the microtome sections retained for sampling of the early (E, F), intermediate (G, H) and late (I, J) crown root primordia tissues. D: autofluorescence image of a stem base section where cortex tissue was sampled (purple contours). E, F: autofluorescence image of a stem base section before (E) and after (F) laser capture microdissection of early stage developing crown root tissue. G, H: autofluorescence image of a stem base section before (G) and after (H) laser capture microdissection of intermediate stage developing crown root tissue. I, J: autofluorescence image of a stem base section before (I) and after (J) laser capture microdissection of late stage developing crown root tissue.

