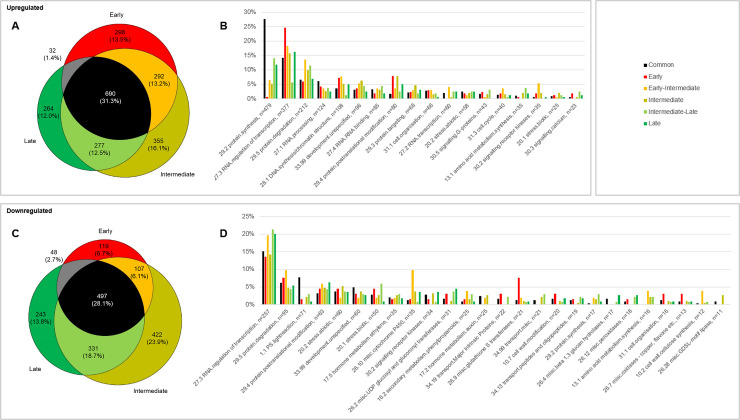
Fig 2. Repartition of detected DEG in the three developmental stages between the most represented second-level MapMan ontologies.
A: Venn diagram of the number and percentage relative to the total up- or down-regulated DEG of upregulated DEG between the cortex and the early, intermediate and late crown root primordia developmental stages. B: Frequency of mapping of the Venn diagram sections to the most represented MapMan ontologies for upregulated genes. Only the ontologies grouping at least 2% of upregulated or downregulated DEG for one or more Venn segment were plotted. The Late-Early Venn section was not represented. C: Venn diagram of the number and percentage relative to the total up- or downregulated DEG of downregulated DEG between the cortex and the early, intermediate and late crown root primordia developmental stages. D: Frequency of mapping of the Venn diagram sections to the most represented MapMan ontologies for downregulated genes. Only the ontologies grouping at least 2% of upregulated or downregulated DEG for one or more Venn segment were plotted. The Late-Early Venn section was not represented. Ontologies were sorted by decreasing number of DEG (n value).

