. 2020 Nov 11;9:e58360. doi: 10.7554/eLife.58360

Figure 3. Large proportions of face cells show modulation by conscious percept.

The scatterplot shows modulation indices (RfaceRobject)/(Rface+Robject) measuring the difference in responses (i.e., average spike count R) on trials where the inferred percept was face vs. trials where the inferred percept was object for the physical monocular condition (x-axis) and perceptual binocular rivalry condition (y-axis). Yellow and orange triangles show cells from ML without and with significant difference between perceived face and perceived object response in the binocular rivalry condition, respectively. Blue and green squares show cells from AM without and with significant difference between perceived face and perceived object response in the binocular rivalry condition, respectively.
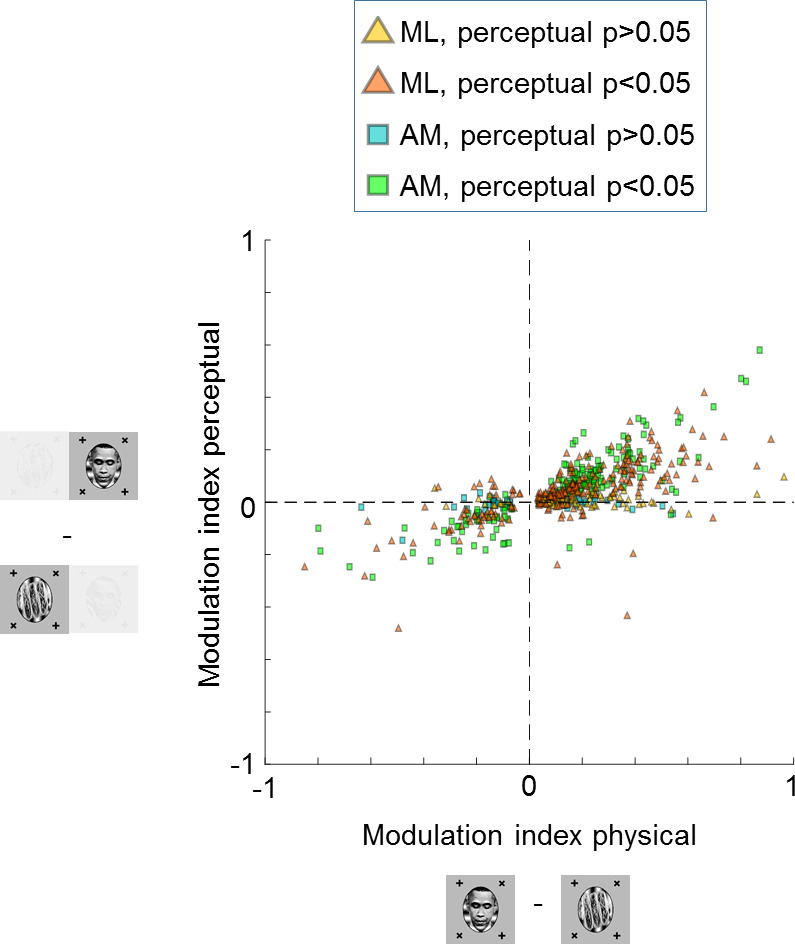
Figure 3.

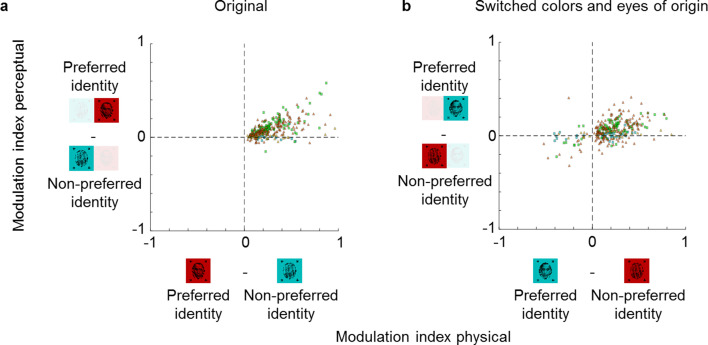
Figure 3—figure supplement 1. Color and eye-of-origin confound control.

Figure 3—figure supplement 1.

Left: Scatterplot similar to Figure 3 but modulation indices (RpreferredRnonpreferred)/(Rpreferred+Rnonpreferred) now show the difference between preferred and non-preferred stimulus. The preferred stimulus is face if the response to face is higher and non-face object if the response to non-face object is higher in the physical condition. Thus, by definition the x-values of all cells are positive. Right: Scatterplot of modulation indices (RpreferredRnonpreferred)/(Rpreferred+Rnonpreferred) for the same preferred and non-preferred object identities of stimuli when the colors and eye-of-origin of the two stimuli were switched. Importantly, the preference of a given stimulus identity was assigned based on responses to stimuli of the original color and eye-of-origin. N = 193 for ML and N = 120 for AM for both plots. Symbols have same conventions as in Figure 3.