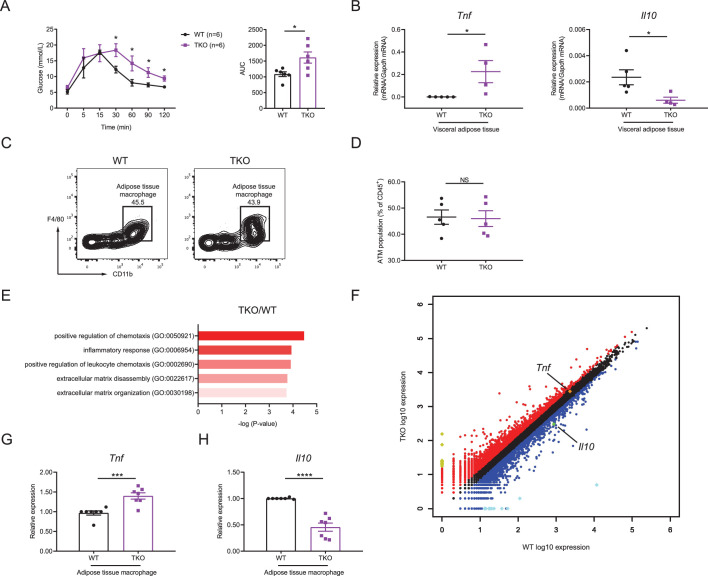
Figure 2. miR-17~92 family miRNAs maintain adipose tissue macrophage (ATM) homeostasis.
(A) Glucose tolerance test in WT and TKO mice (left panel); area under curve (AUC) of left panel (right panel), n = 6 per group. (B) qPCR analysis of Tnf and Il10 mRNA in visceral adipose tissue of WT and TKO mice. (C and D) Flow cytometry of ATM population in WT and TKO mice. (C) A representative figure showing the ATM population of CD45+ cells; (D) cumulative quantification of ATM population as in (C). (E and F) ATMs were sorted from WT and TKO mice fed with regular chow diet, RNA samples of ATMs were extracted and pooled from two mice, and genome-wide RNA profiling analyses were performed. (E) Gene ontology (GO) analysis of WT and TKO ATM RNA-seq datasets showing the enriched GO terms in TKO ATMs; (F) RNA-seq analysis showing RNA expression in TKO ATMs versus those in WT cells. RNAs upregulated in TKO ATMs were colored red, whereas RNAs downregulated were colored blue, gene Tnf was pointed out and colored orange, and gene Il10 was pointed out and colored green. Top 10 upregulated genes (Ighg2b, Gm11843, Dcdc2a, Mmp7, Slc38a5, Tenm2, Cdh16, Ptn, Ighv1-42, and Nanp) were colored yellow and top 10 downregulated genes (Csf2ra, Zfp125, Cxcl5, Ighv14-3, Igkv4-59, Igkv6-20, Igkv16-104, Fth-ps2, Igkv4-91, and B230303A05Rik) were colored bright blue. (G and H) qPCR analysis of Tnf (G) and Il10 (H) mRNA in ATMs of WT and TKO mice. Results were shown as relative expression normalized to those expressions in one WT mice of each experiment. NS, not significant (p>0.05); *p<0.05, ***p<0.001, and ****p<0.0001 (unpaired Student’s t-test). Data are representative of three independent experiments (C) or are pooled from two (A), three (B and D), or five (G and H) independent experiments (mean ± sem).

