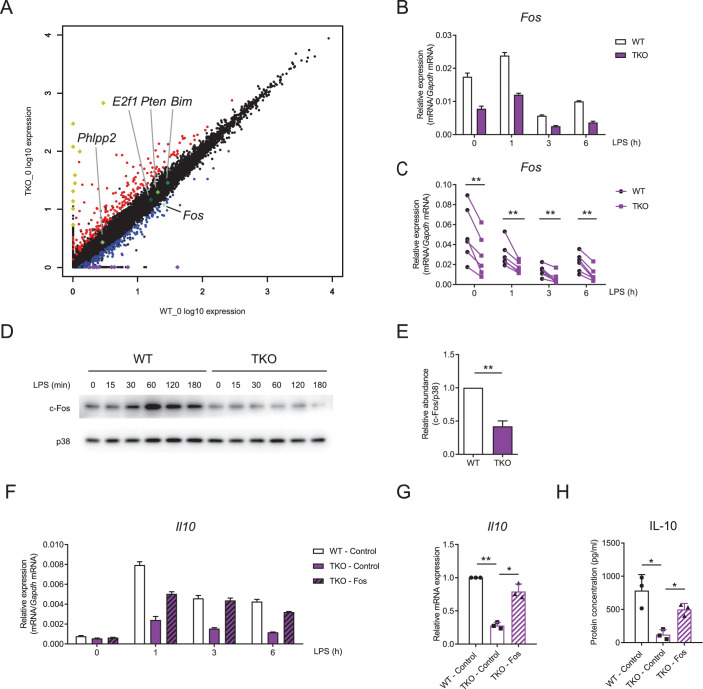
Figure 5. miR-17~92 family miRNAs promote the expression of Fos in macrophages.
(A) RNA-seq analysis showing RNA expression in TKO BMDMs versus those in WT cells. RNAs upregulated in TKO BMDMs were colored red, whereas RNAs downregulated were colored blue, gene Fos was pointed out and colored bright blue, and genes Phlpp2, E2f1, Pten, and Bim were pointed out and colored green. Top 10 upregulated genes (Atp6v0c-ps2, Hmga1-rs1, H2-Q6, H2-Ea-ps, Gm8580, Gm8909, Sap25, LOC547349, H2–l, and H2–Q10) were colored yellow and top 10 downregulated genes (Mir8114, 0610010B08Rik, Gm14430, Gm8615, Asb4, Gm14305, 6230416C02Rik, Gm38431, Pira7, and Cpt1b) were colored purple. (B and C) qPCR analysis of Fos mRNA in WT and TKO BMDMs stimulated for the indicated periods with LPS. (D) Immunoblotting analysis of c-Fos ad p38 (loading control) in whole-cell lysates of WT and TKO BMDMs treated for the indicated periods with LPS. (E) Quantifications of c-Fos protein abundance in unstimulated condition in (D) by densitometry from four independent experiments. (F) qPCR analysis of Il10 mRNA in WT and TKO BMDMs transfected with control or Fos overexpression vector and stimulated for the indicated periods with LPS. (G) Cumulative results from three independent experiments of Il10 levels in LPS-stimulated 6 hr results as in (F), normalized to mRNA expression in control vector transfected WT cells. (H) ELISA of IL-10 in supernatants from WT and TKO BMDMs transfected with control or Fos overexpression vector and stimulated with LPS for 12 hr. *p<0.05 and **p<0.01 (paired Student’s t-test). Data are representative of six (B), four (D), or three (F) independent experiments or are pooled from six (C), four (E), or three (G and H) independent experiments (mean + s.d.).


