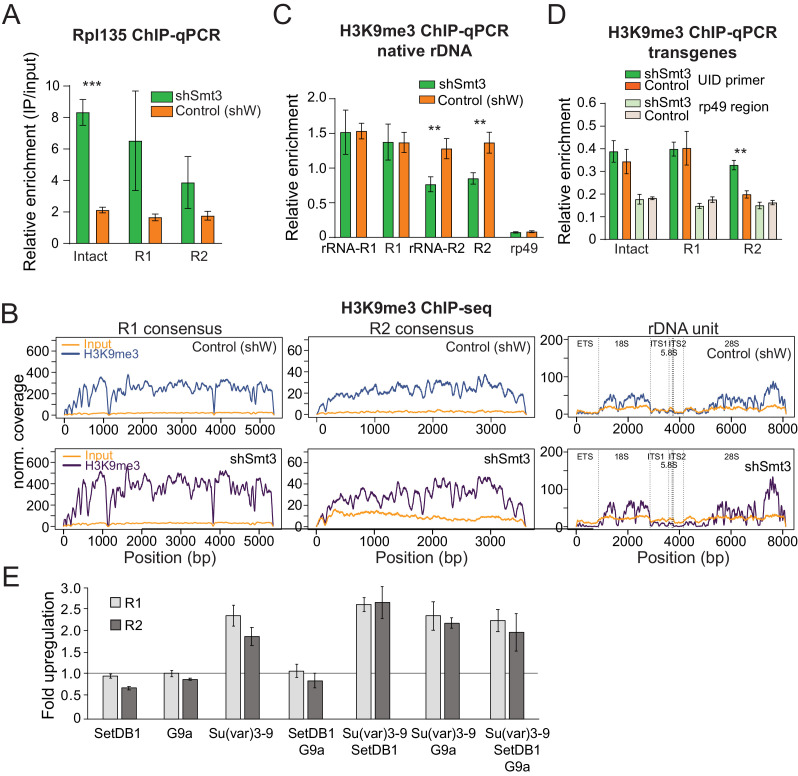
Figure 5. SUMO KD does not affect H3K9me3 enrichment over rDNA and R1/R2.
(A) Pol I occupancy increases over rDNA transgenes upon SUMO KD Germline-specific knockdown of SUMO (shSmt3) or control (shW) gene was induced by small hairpin driven by maternal-tubulin-Gal4 driver. ChIP of Rpl135-GFP using a GFP antibody for pull-down was followed by qPCR analysis using UID-specific primers. Data were normalized using a sequence mapping to a gene-poor region. Error bars indicate standard deviation of three biological replicates. Statistical significance is estimated by two-tailed Student’s t-test; ***p<0.001. (B-C) H3K9me3 enrichment over native rDNA and the R1 and R2 transposons sequences is unaffected by SUMO KD. Germline knockdown was induced by small hairpin driven by maternal-tubulin-Gal4 driver (B) H3K9me3 ChIP-seq signal and corresponding input coverage across the R1 and R2 consensus sequences (RepBase), and the rDNA unit (Stage and Eickbush, 2007) from control (shW) and SUMO-depleted (shSmt3) ovaries. Data is normalized to total reads mapping to the genome. (C) H3K9me3 ChIP-qPCR using primers to native 28S rDNA interrupted with R1 and R2 insertions as in Figure 3D. ChIP to input enrichment is normalized to the region that has high level of H3K9me3 mark (chr2R: 4,141,405–4,141,502). Error bars indicate the standard deviation of three biological replicates. Statistical significance is estimated by two-tailed Student’s t-test; **p<0.01. (D) H3K9me3 mark measured on rDNA transgenes by ChIP-qPCR. H3K9me3 ChIP-qPCR analysis of rDNA transgenes in control (shW) and SUMO-depleted (shSmt3) ovaries using primers to the UID sequence and RP49 (control region), normalized to H3K9me3-enriched region (chr2R: 4,141,405 ~ 4,141,502). Error bars indicate the standard deviation of three biological replicates. Statistical significance is estimated by two-tailed Student’s t-test; **p<0.01. (E) Impact of knock-down of H3K9 methyltransferases on R1 and R2 expression. Three H3K9 methyltransferases were depleted in S2 cells using RNAi individually and in combination. Expression of R1 and R2 transposons was measured by RT-qPCR and normalized to rp49 mRNA. Shown is fold upregulation of R1 and R2 expression upon knock-down compared to control (double-stranded RNA against eGFP gene). Expression levels were measured in three biological replicates. Statistical significance is estimated by two-tailed Student’s t-test; *p<0.05, **p<0.01, ***p<0.001. Information about efficiency of RNAi KD is shown in Supplementary file 4.


