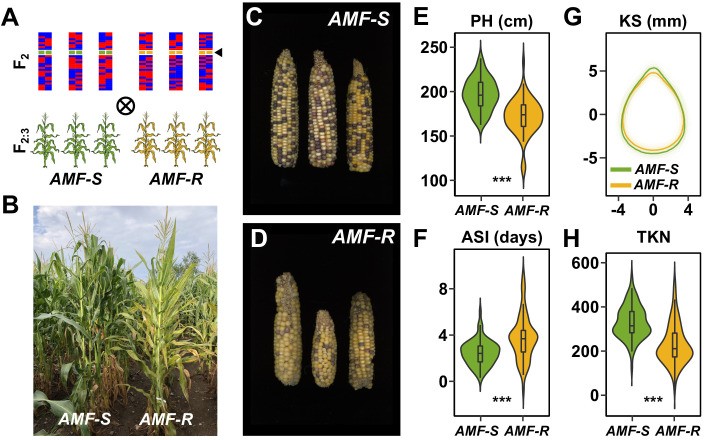
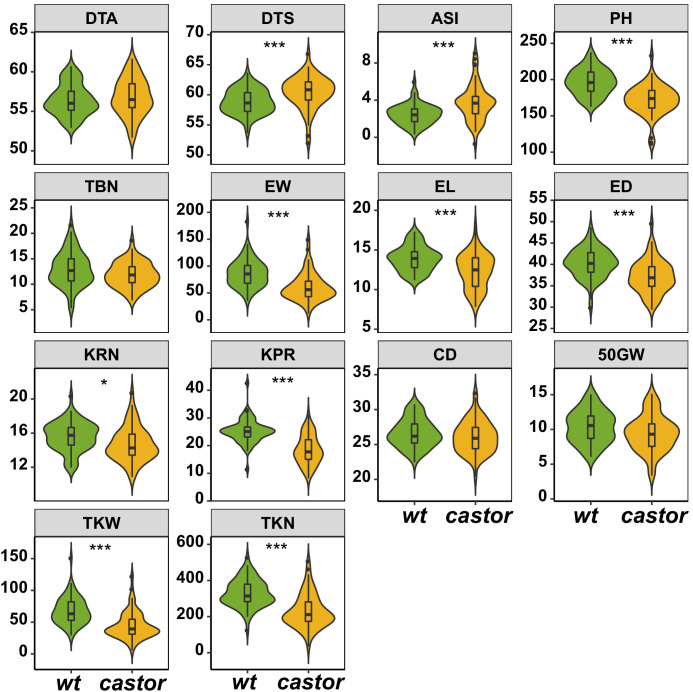
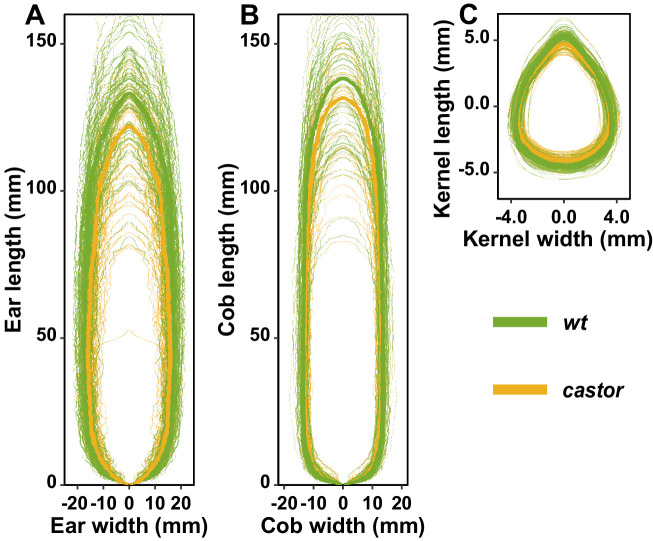
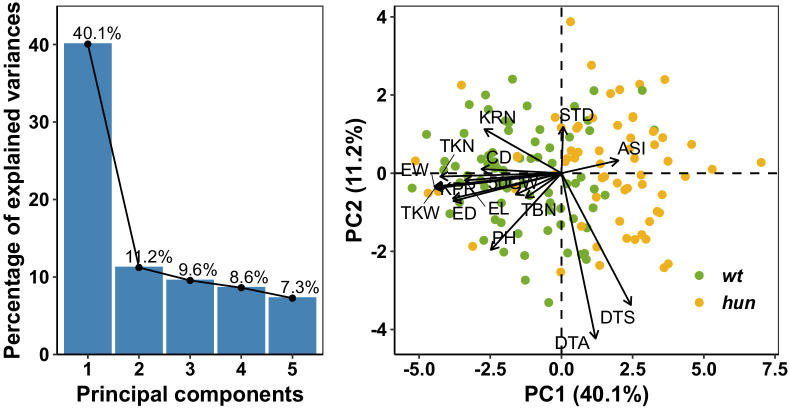
Figure 2. Mycorrhizal symbiosis promotes maize growth under cultivation.
(A) Susceptible (AMF-S) and resistant (AMF-R) families segregate genomic content from two founder parents, shown as red and blue bars, but are homozygous for the wild-type (green) or mutant (yellow) allele at Castor (black arrow), respectively, blocking AM symbiosis in AMF-R. (B), Border between representative AMF-S and AMF-R plots, Ameca, Mexico, 2019. (C), Representative AMF-S ears. (D), Representative AMF-R ears. (E), Plant height (PH) of 73 AMF-S (green) and 64 AMF-R (yellow) families. (F), Anthesis-silking interval (ASI). (G), Kernel shape (KS) based on the analysis of scanned kernel images . (H), Total kernel number (TKN). The violin plots in (E, F and H) are a hybrid of boxplot and density plot. The box represents the interquartile range with the horizontal line representing the median and whiskers extending 1.5 times the interquartile range. The shape of the violin plot represents the probability density at different values along the y-axis. ***, difference between AMF-S and AMF-R significant at p<0.001 (Wilcoxon test; Bonferonni adjustment based on the total trait number).

