. 2020 Nov 19;9:e61701. doi: 10.7554/eLife.61701

Figure 3. QTL x AMF effects contribute significantly to variation in host response.

(A) Genomic position of QTL identified in this study. Boxes indicate the position of the peak marker. Bars represent the drop-1 LOD interval. Colors denote patterns of AMF × QTL interaction as described in the text. (B) The contribution of different components to phenotypic variance in different plant traits among AMF-S and AMF-R families. Total genetic variance was estimated based on differences between experimental blocks and partitioned into variation explained by the additive effect of AMF, the additional variation explained by interactive QTL and QTL × AMF interaction (QTL × AMF), the additional variation explained by additive QTL (QTL) and residual genetic variation (Res H2). The balance of the phenotypic variance was assigned to the environment (E). Traits codes as in Table 1.

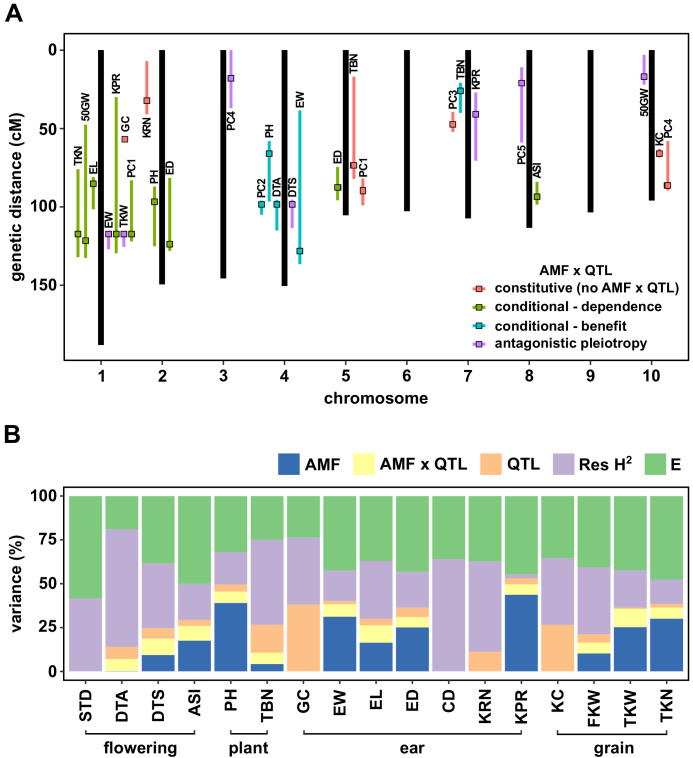
Figure 3—source data 1. QTL analysis.
LOD plots of the single-scan QTL performed on the 17 traits studied (see Supplementary file 1 Table S2 for trait codes). The color of the line represents the different models considered: AMF-S families only (H0wt, blue line), AMF-R only (H0hun, red line), AMF as an additive covariate (Ha, yellow line), AMF as an interactive covariate (Hf, purple line), and the evidence of interaction (Hi, green line). The solid line represents the QTL and drop 1-LOD confidence interval. The horizontal dotted line represents the LOD threshold obtained with a 1000 permutations(α = 0.05) for H0wt, H0hun, Ha, and Hf and calculated as LOD_thri = LOD_thrf - LOD_thra for Hi.

Figure 3.

Figure 3—figure supplement 1. Genotypic analysis.

Figure 3—figure supplement 1.

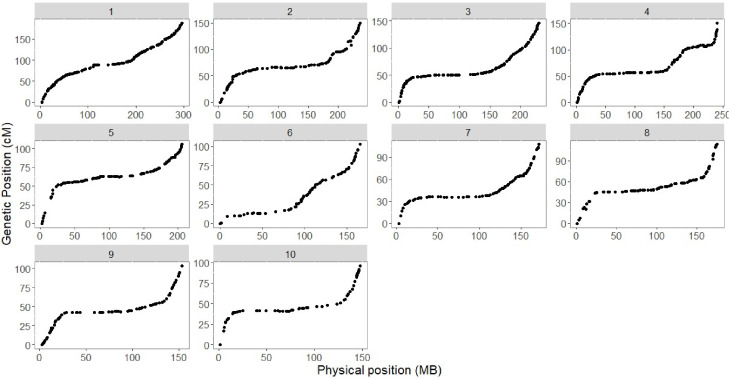
Plot of genetic (y axis) and physical (x axis) position for 1050 genetic markers that compose the genetic map of the CML312 x W22 castor-2 F2 population.
Figure 3—figure supplement 2. Genetic map.

Figure 3—figure supplement 2.

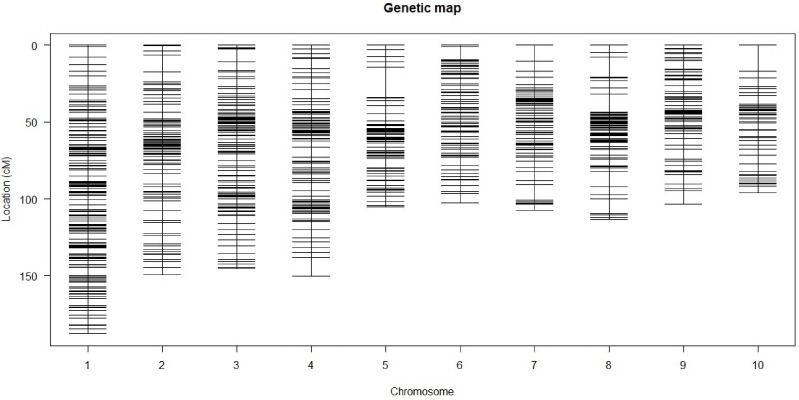
Plot representing the estimated genetic map and the marker distribution across the ten chromosomes of maize for the CML312 × W22 castor-2 F2 population.