. 2020 Nov 19;9:e61701. doi: 10.7554/eLife.61701

Figure 4. Mycorrhiza response confounds benefit and dependence.

(A) Host response (R) is the difference in trait value between mycorrhizal (M; green) and non-mycorrhizal (NM, yellow) plants. Increased response can result from either greater dependence (D; poorer performance of NM plants) or greater benefit (B; greater performance of M plants). (B), QTL × AMF effects underlying variation in response reveal the balance of benefit and dependence. In this theoretical example, the effect is conditional on mycorrhizal colonization, reflecting a difference in benefit more than dependence. (C, D) Effect plots for major QTL associated with PC1 and PC2, respectively. Effect of the homozygous CML312 (red), homozygous W22 (blue), or heterozygous (brown) genotypes in AMF-S and AMF-R families. The PC1 QTL is conditional on AMF-R, indicating a difference in dependence. The PC2 QTL is conditional on AMF-S, indicating a difference in benefit.

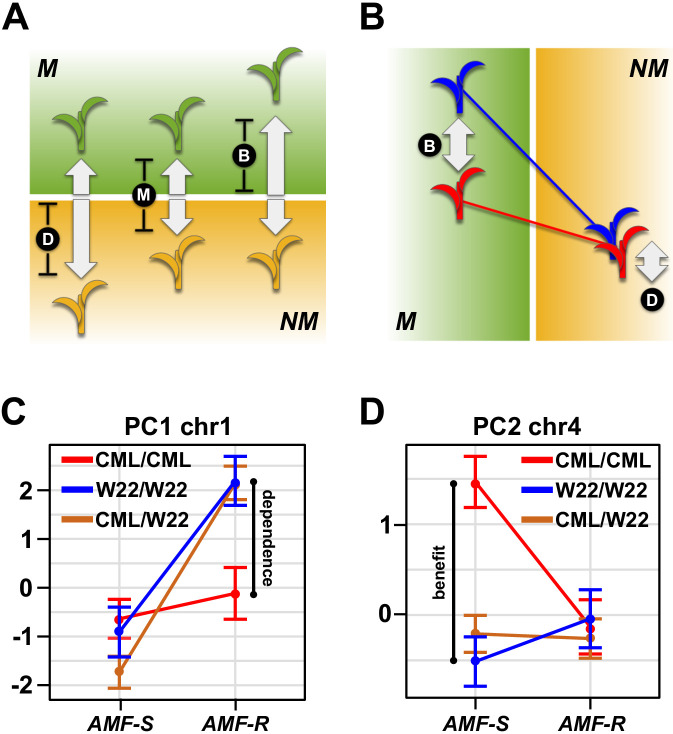
Figure 4—source data 1. QTL analysis.
Effect plots for major QTL detected in the analysis across susceptible (AMF-S) and resistant (AMF-R) families. The title of the plot gives the marker nearest to the LOD peak, and the color of the line represents the genotype at the QTL.

Figure 4.

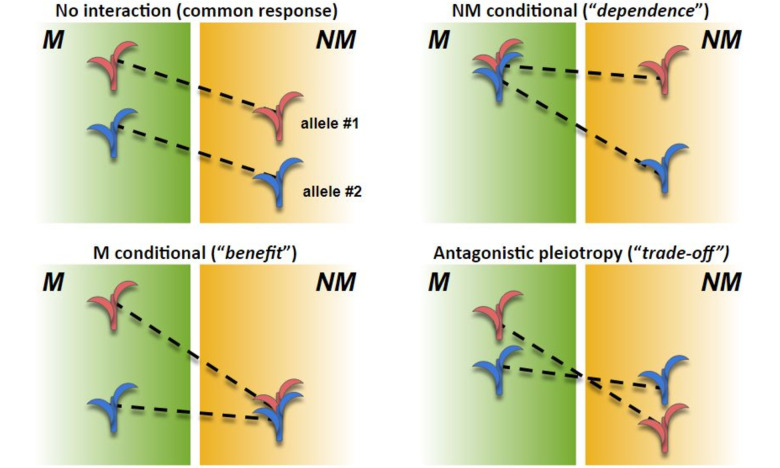
Figure 4—figure supplement 1. Scenarios in AMF x genotype interaction.

Figure 4—figure supplement 1.

Theoretical performance (arbitrary units; y axis) of mycorrhizal (M) and non-mycorrhizal (NM) plants of two genotypes (red and blue). The difference between M and NM defines response for a given genotype. (Top left) No AMF × genotype interaction. Both genotypes respond equally to AMF; the difference between varieties is constant between M and NM. (Top right) NM conditional. Response is higher in the blue genotype; difference between genotypes is conditional on NM treatment; response variation is driven by greater dependence of the blue genotype. (Bottom left) M conditional. Response is higher in the red genotype; difference between genotypes is conditional on M treatment; response variation is driven by greater benefit of the blue genotype. (Bottom right) Antagonistic pleiotropy. Response is higher in the red genotype; difference between the genotypes is expressed in both M and NM, but the sign of the effect changes; the red genotype is superior in M growth but inferior in NM growth.