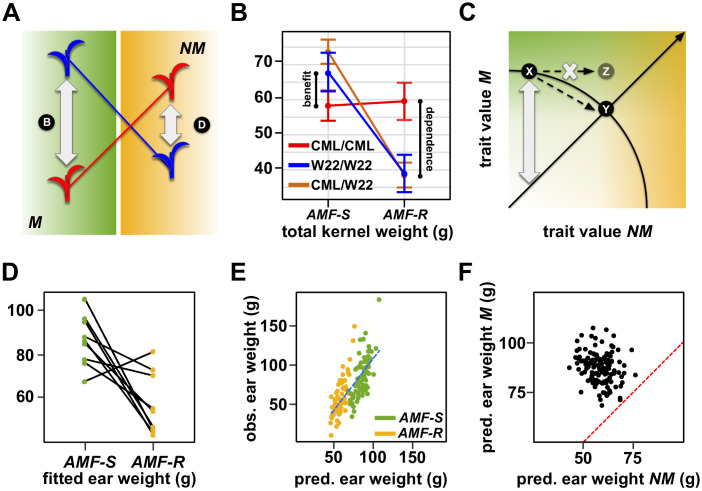
Figure 5. The genetic architecture of mycorrhiza response implies a trade-off between dependence and benefit.
(A) Extreme QTL × AMF effects result in antagonistic pleiotropy. In this theoretical example, the blue allele is superior in mycorrhizal (M) plants, while the red allele is superior in non-mycorrhizal (NM) plants. Such a QTL is linked to differences in both dependence and benefit. (B) Effect plot for a total kernel weight (TKW) QTL located on Chromosome 1. TKW of families homozygous for the CML312 allele at this locus (red) is stable across susceptible (AMF-S) and resistant (AMF-R) families. In contrast, families homozygous for the W22 allele (blue) or heterozygous at this locus (brown), show superior TKW if AMF-S but lower TKW if AMF-R. (C) Theoretical trade-off between the performance of non-mycorrhizal (NM) and mycorrhizal (M) plants. For any position on this plot, the vertical distance above the diagonal indicates the magnitude of host response. Trade-off prevents occupancy of the upper-right of the plot, defining a so-called ‘Pareto front’ (solid arc). Here an increase in the NM performance of variety X is necessarily accompanied by a reduction in M performance, as described by movement along the arc to condition Y. Biological constraint prevents the path towards condition Z. (D) Fitted ear weight values for all genotypes from a multiple QTL model under both levels of AMF (AMF-S and AMF-R). Line segments connect the same plant genotype under the two AMF levels. (E) Observed ear weight against whole-genome prediction for 73 susceptible (AMF-S) and 64 resistant (AMF-R) families. Best fit regression line in dashed blue. (F) Predicted ear weights for all 137 genotypes based on AMF-S (M) and AMF-R (NM) whole-genome models. Dashed red line shows AMF-S = AMF R, that is, no host response.

