
Figure 4.
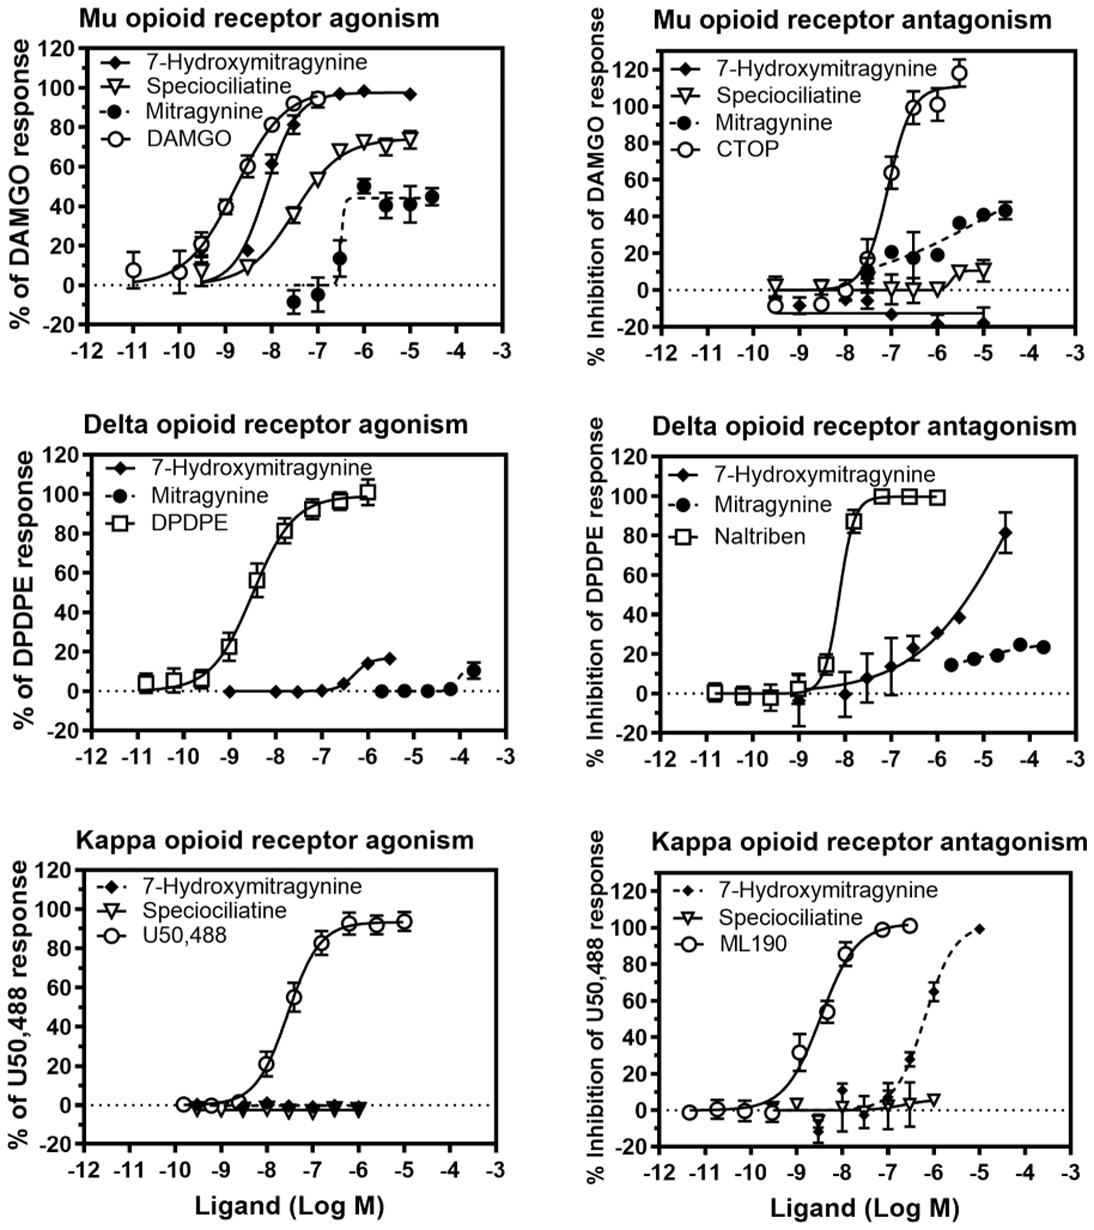
Concentration effect curves of mitragynine and 7-hydroxymitragynine at MOP (top left), DOP (middle left), and KOP (bottom left). Concentration % inhibition of control agonist effect curves of mitragynine and 7-hydroxymitragynine at MOP (top right), DOP (middle right), and KOP (bottom right). The EC50 of 7-hydroxymitragynine, speciociliatine, and mitragynine at MOP were determined as 7.6, 39.2, and 307.5 nM, respectively. The KB of 7-hydroxymitragynine at DOP and KOP were determined as 550.2 and 115.0 nM, respectively. The KB of mitragynine at MOP was determined as 179.2 nM.