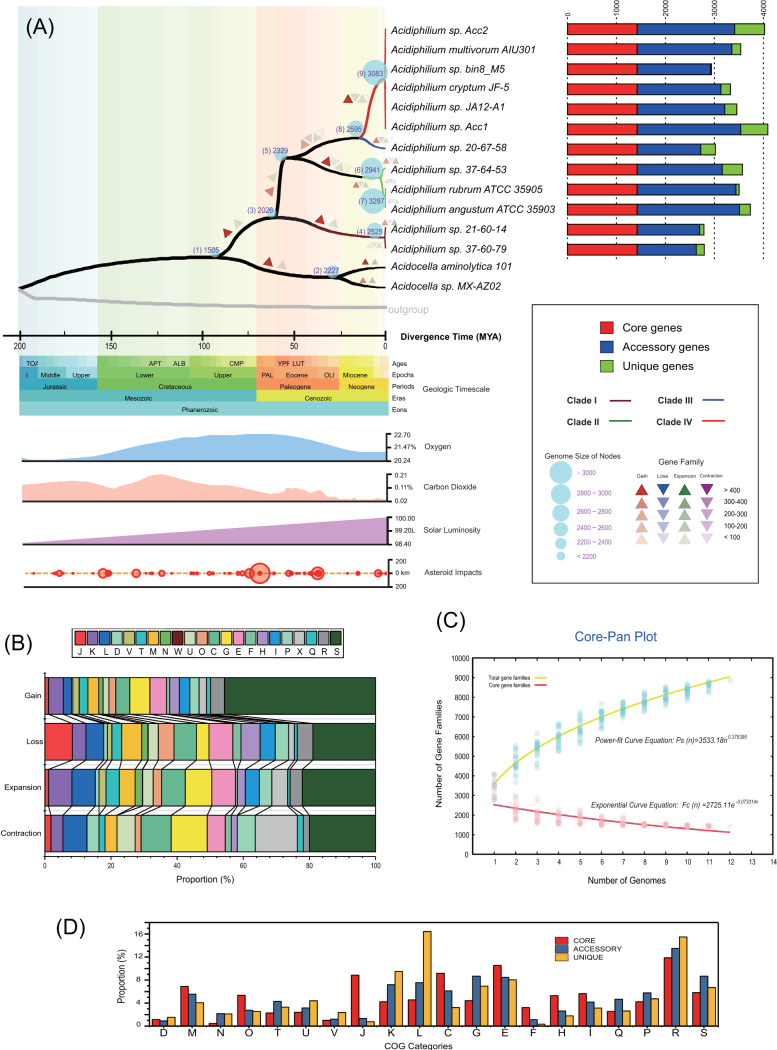
FIG 1.
(A) The evolutionary timeline of Acidiphilium was estimated (left) using RelTime on top of the rooted NJ tree based on the concatenated alignment of 133 core genes. Ancestral genome content reconstruction of Acidiphilium was performed with Count software, and the color depth represents the numbers of reconstructed gain, loss, expansion, and contraction events of each lineage. Data of asteroid impacts, solar luminosity, and fluctuations in atmospheric oxygen and carbon dioxide concentrations are displayed synchronously with divergence times in the form of time panels (left). A stack bar diagram (right) shows the number of genes shared by all strains (i.e., the core genome), the number of genes shared by partial strains (i.e., the accessory genome), and the number of strain-specific genes (i.e., the unique gene) in the tested strains. (B) Stack bar chart showing functional proportions of Acidiphilium gene families undergoing gain, loss, expansion, and contraction events as based on COG classes. (C) Mathematical modeling of the pangenome and core genome of Acidiphilium. (D) Bar chart showing functional proportions (based on COG categories) of different parts of the Acidiphilium pangenome (i.e., core, accessory, unique). Detailed descriptions of the COG categories are provided in Text S1 in the supplemental material.

