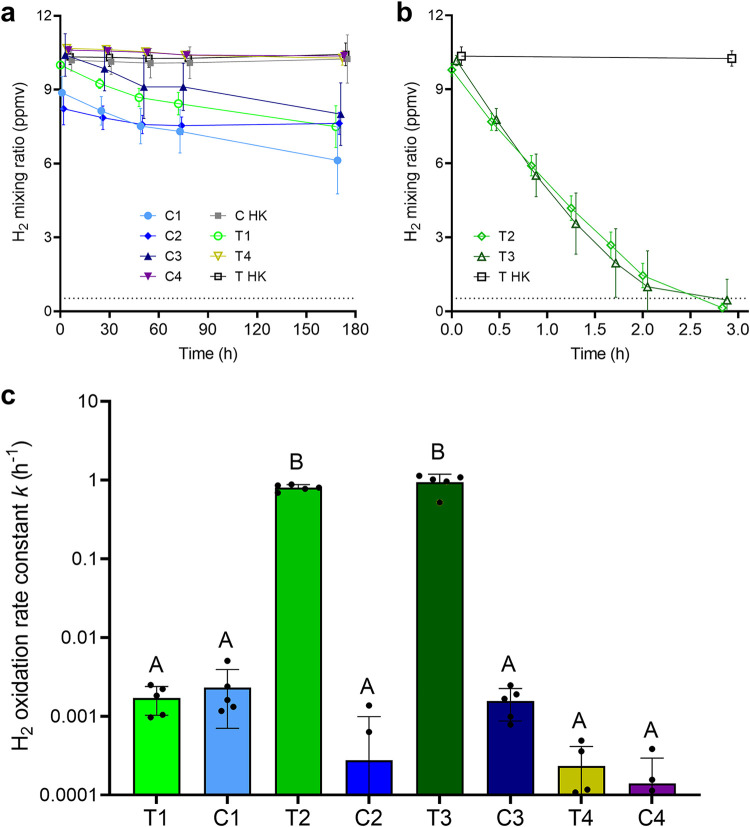
FIG 3.
H2 oxidation by Australian desert soil microcosm samples. Headspace H2 mixing ratios were measured by gas chromatography over an extended period (180 h) for slow-oxidizing dry samples (T1, T4, C1, C2, C3, and C4) (a) and a short period (3 h) for fast-oxidizing wet samples (T2 and T3) (b). Symbols show means and error bars show standard deviations from five independent microcosms. Heat-killed controls were also tested for each sampling point (C HK and T HK). The gray dashed line at 0.53 ppmv indicates the average global atmospheric concentration of H2. (c) Comparison of first-order rate constants (k) for H2 oxidation calculated at each sampling point based on five replicate microcosms. Samples labeled with different letters are significantly different based on one-way ANOVA (P < 0.0001). As heat-killed controls did not consume H2, rate constants are shown only for the samples with live microorganisms.

