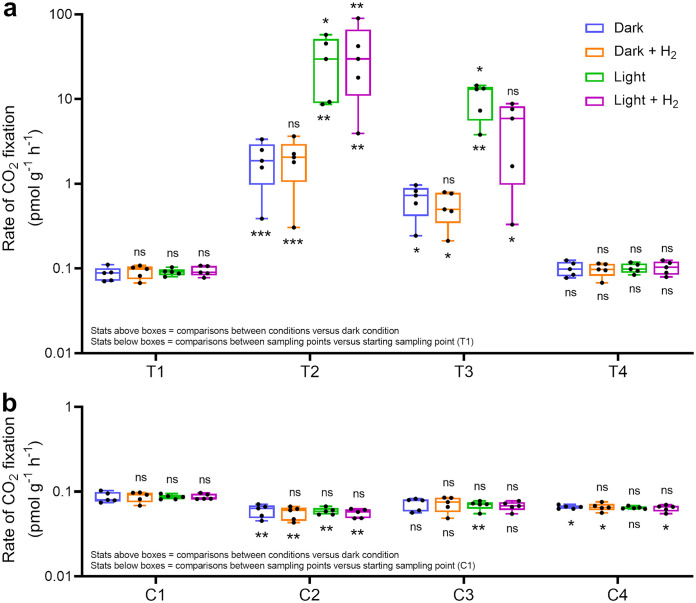
FIG 4.
Carbon dioxide fixation by the Australian desert soil microcosm samples. Samples from treatment microcosms (a) and control microcosms (b) were incubated with 14C-labeled CO2 under four different conditions. Rates were determined by counting 14C fixed in live samples and subtracting background counts from heat-killed controls. Each individual boxplot shows the rate of 14C fixation for five independent microcosms each run in technical quadruplicate (averaged). Center values show medians, boxes show upper and lower quartiles, and whiskers show maximum and minimum values. Symbols above the boxes indicate whether significant differences were observed between H2-supplemented, light-illuminated, and joint treatment conditions relative to the dark condition at each sampling point. One-way ANOVA was used to test significant differences. ns, not significant. *, P < 0.05; **, P < 0.01; ***, P < 0.001. Symbols below the boxes indicate whether significant differences were observed between the sampling points for each condition relative to the starting sampling point (T1 and C1). Significant differences were also observed in 14C counts between the T2 and C2 samples (P < 0.01), and the T3 and C3 samples (P < 0.05), under each condition.

