FIG 5.
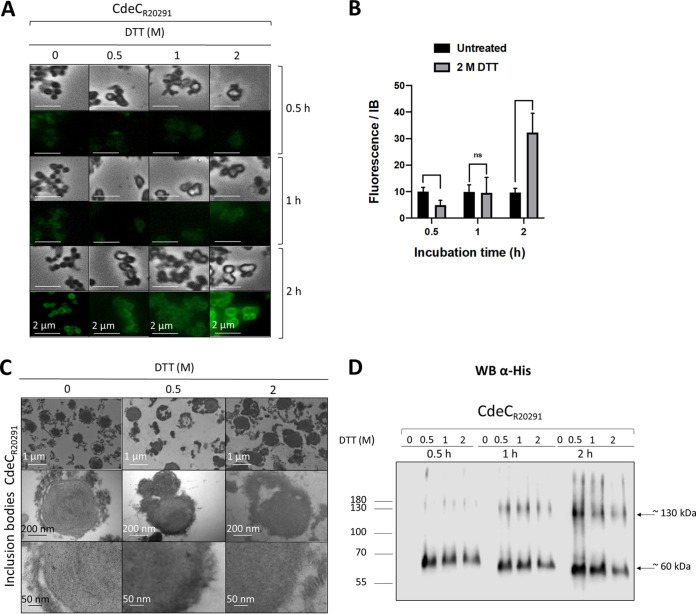
Effect of DTT treatment on the ultrastructure of the inclusion bodies of CdeC. (A) The partially purified inclusion bodies were treated with 0.5, 1, or 2 M DTT for 30, 60, or 120 min at 37°C. After each treatment, the pellet obtained was analyzed by immunofluorescence using anti-6×His as first antibody and a secondary antibody conjugated with Alexa Fluor 488. (B) Quantification of the fluorescence intensity of the inclusion bodies treated with 2 M DTT. The bars in the graph show the means ± standard errors of the means (SEMs) of 10 analyzed inclusion bodies. The statistical significance was determined by a two-way analysis of variance (ANOVA) using Sidak’s multiple-comparison test. ns, no significance. (C) Samples of purified inclusion bodies treated with 0.5 or 2 M DTT for 120 min were analyzed by TEM. (Top) Representative micrographs of several inclusion bodies. (Bottom) Magnified view of the thin section of inclusion bodies. (D) Western blot analysis of CdeC inclusion bodies after DTT treatment. The resulting final pellets of each treatment were electrophoresed in 12% SDS-PAGE gels, and His-tagged immunoreactive proteins were detected by Western blotting as described in Materials and Methods. Molecular mass (kDa) markers are indicated at the left, and molecular mass of the detected His-tagged immunoreactive bands is indicated at the right.

