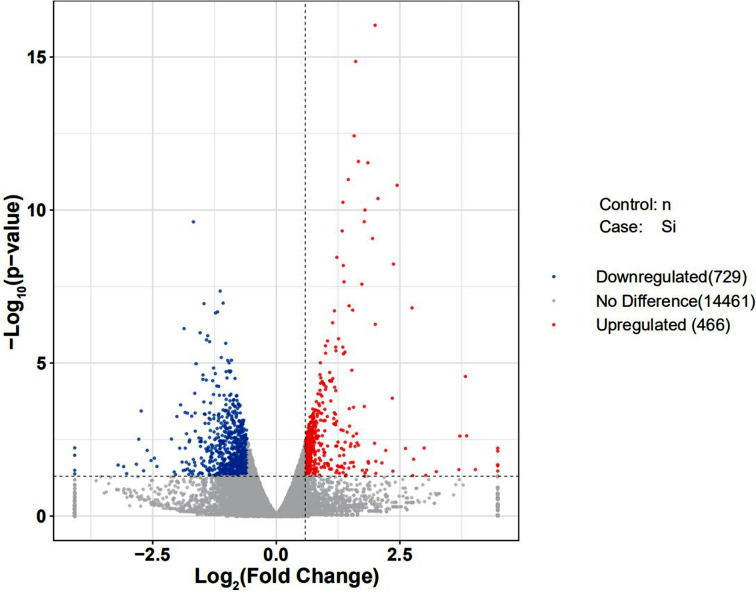
Fig. 4.
Volcano map of differentially expressed genes. The two dashed vertical lines are the thresholds of 2 times, the dashed horizontal line is the threshold of P-value=0.05, the red dots are the upregulated genes, the blue dots are the downregulated genes, and gray dots represent nonsignificantly differentially expressed genes (n v.s. Si).

