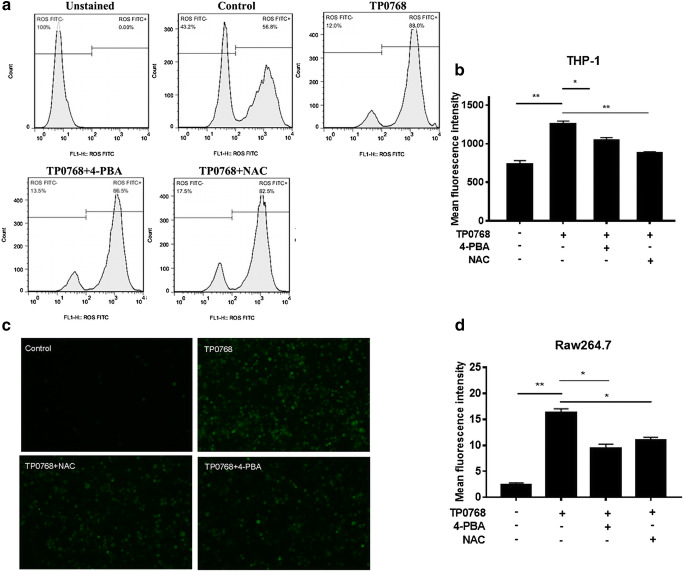
Fig. 3.
Tp0768-induced ROS release. a THP-1–differentiated macrophages were treated with Tp0768 in the absence or presence of NAC (5 mM) or 4-PBA (2.5 mM) for 1 h, and the ROS level in the cells were determined using flow cytometry. b Quantitative analysis of the average fluorescence intensity of ROS using FlowJo software. c Analysis of ROS production in Raw264.7 cells using cellular immunofluorescence (× 200). d Quantification of ROS levels using ImageJ software. *p < 0.05, **p < 0.01, and ***p < 0.001 indicate a significant difference

