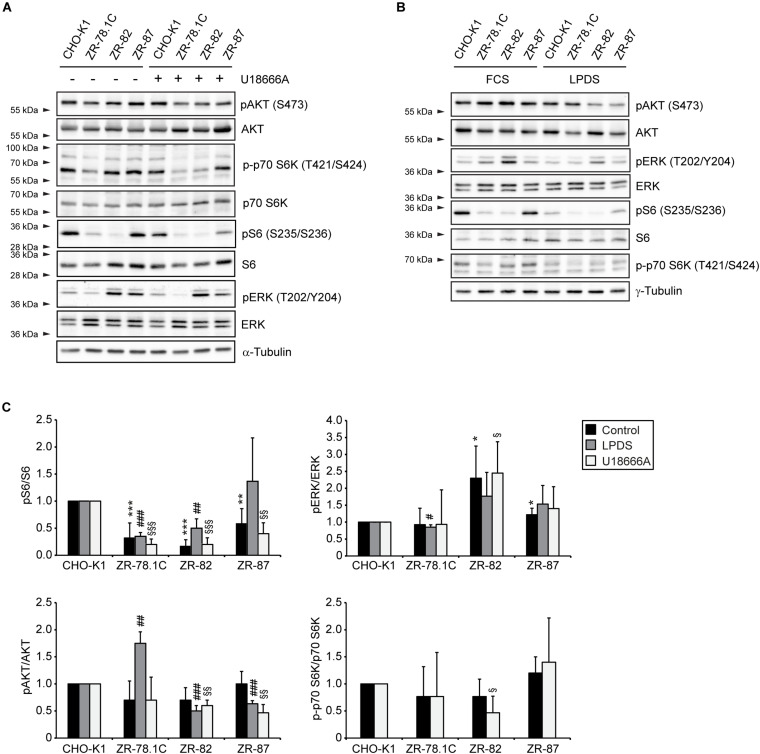
FIGURE 8.
mTORC1, AKT, and MAPK signaling in peroxisome-deficient CHO cells. (A,B) Immunoblot analysis of the mTORC1, AKT, and MAPK pathways of total cell lysates after treatment with 10 μM U18666A (A) or incubation in medium supplemented with 5% LPDS (B) for 24 h. Western blots from a representative of 2–3 independent experiments are shown in panels A,B. (C) For quantification, pAKT, pS6, pERK, and p-p70 S6K levels were normalized to the corresponding total AKT, S6, ERK, and p70 S6K levels, respectively. Protein ratios are expressed relative to that in CHO-K1 cells, which were arbitrarily defined as 1 for each treatment. Data are mean ± SD (n = 2–3). Statistical analysis was performed using Student’s t-test or Student’s t-test with Welch’s correction. ***p < 0.001 vs. FCS-cultured CHO-K1. #p < 0.05; ##p < 0.01; ###p < 0.001 vs. LPDS-cultured CHO-K1. § p < 0.05; §§ p < 0.01; §§§ p < 0.001 vs. U18666A-treated CHO-K1.

