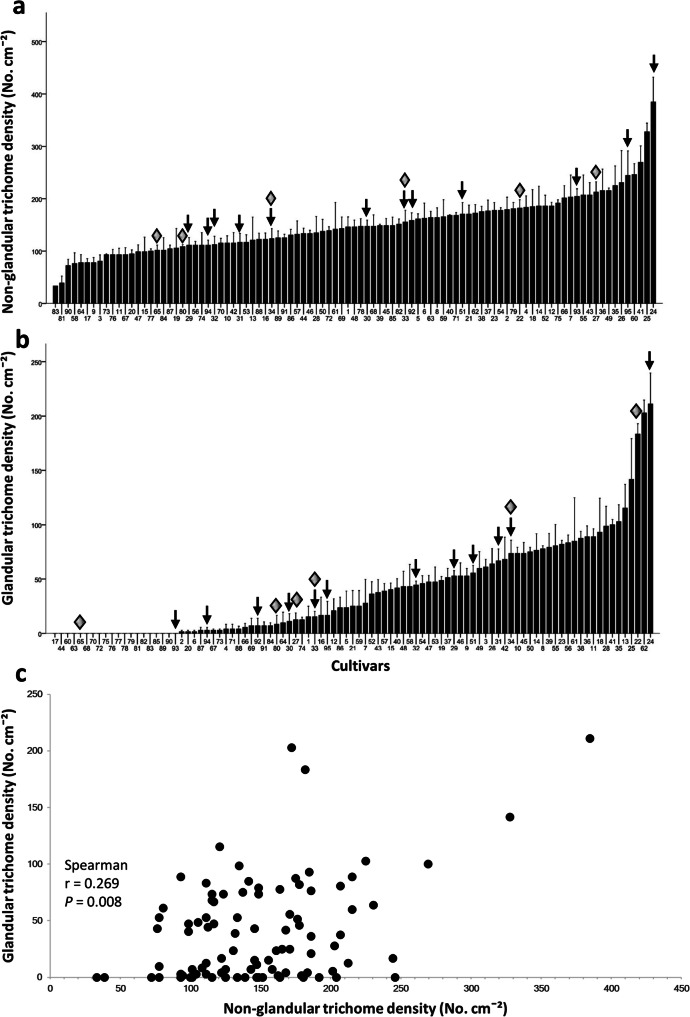
Fig. 2.
Genotypic variation in non-glandular and glandular trichome densities. Bars depict the mean (± SEM, n = 3) of leaf (a) non-glandular and (b) glandular trichome densities analyzed in 95 chrysanthemum cultivars at 35 days after planting. Trichome density was determined on the adaxial side of the third leaf from the apex. The arrows indicate the twelve cultivars used in Experiment 2, while the diamonds indicate the six cultivars used in Experiment 3. (c) Scatter plot depicting the relationship between non-glandular and glandular trichome densities. Each dot corresponds to the mean of three plant replicates per cultivar

