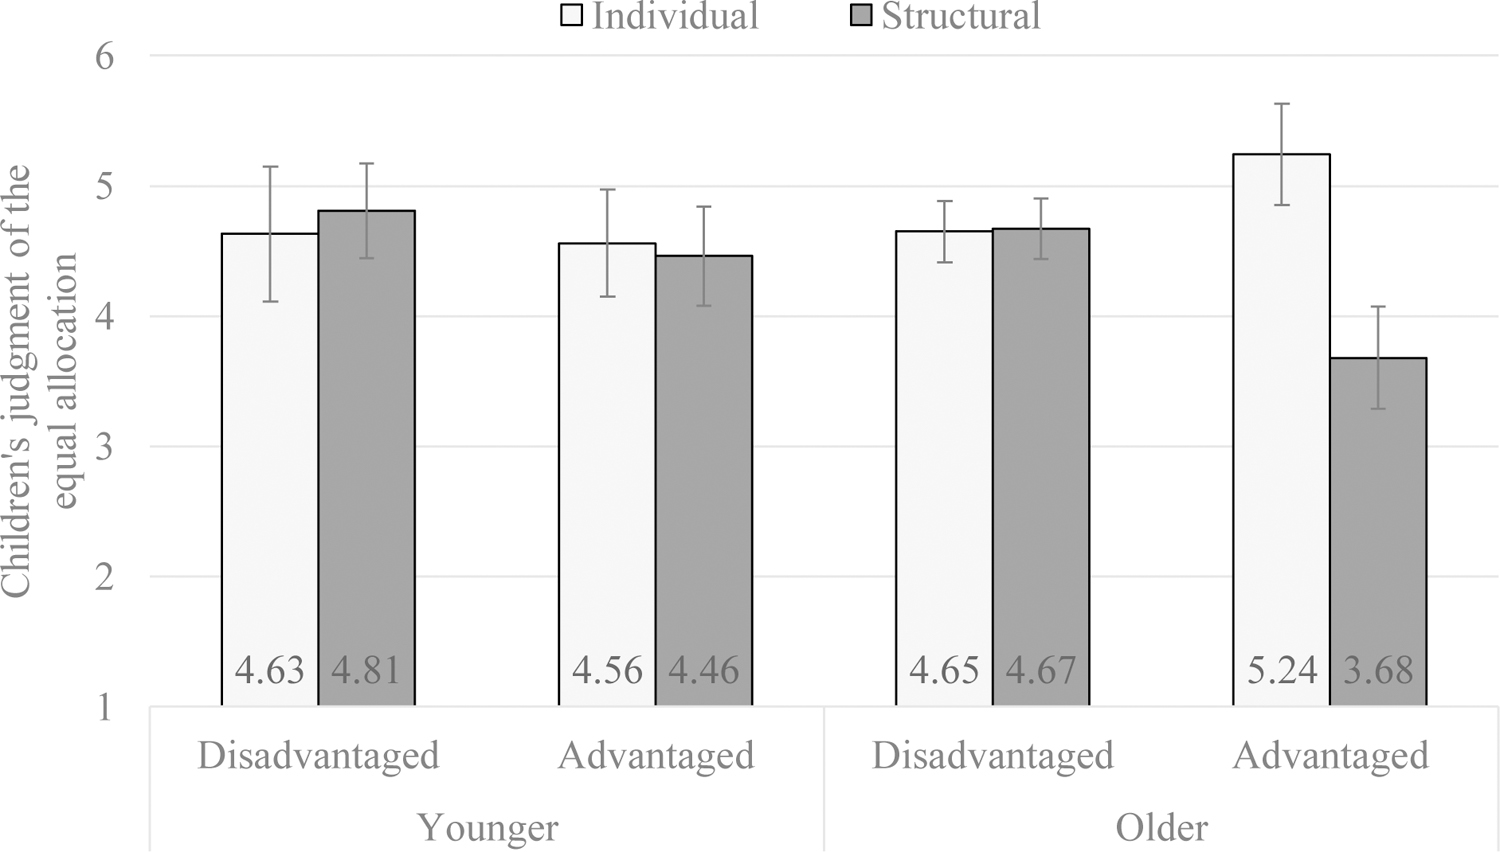
Figure 6.

Children’s judgment of the equal allocation by Age (Younger, Older), Status (Advantaged, Disadvantaged), and Type of Inequality (Individual, Structural). Scale: 1 = “Really Not Okay” to 6 = “Really Okay”. Bars represent the standard error of the means. The figure is presented for descriptive purposes - no significant effects were found.
