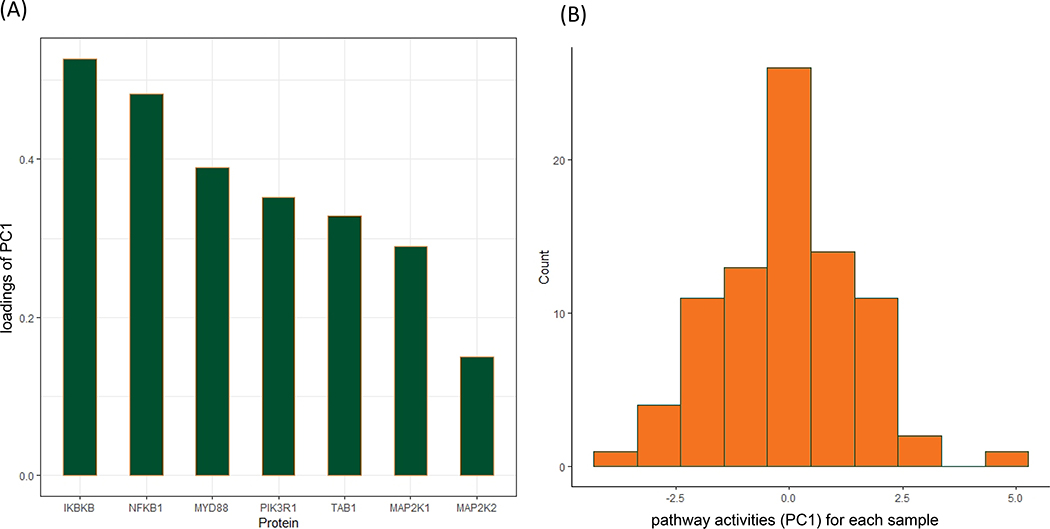
Figure 3.
Protein specific and sample specific estimates for “IL-1 signaling pathway”. (A) Relevant genes selected by AESPCA. Shown are loadings of PC1, which are weights for each gene that contributed to PC1 in AESPCA. (B) Distribution of sample-specific estimate of pathway activities. Shown are estimated PC1 values for each sample in AESPCA.

