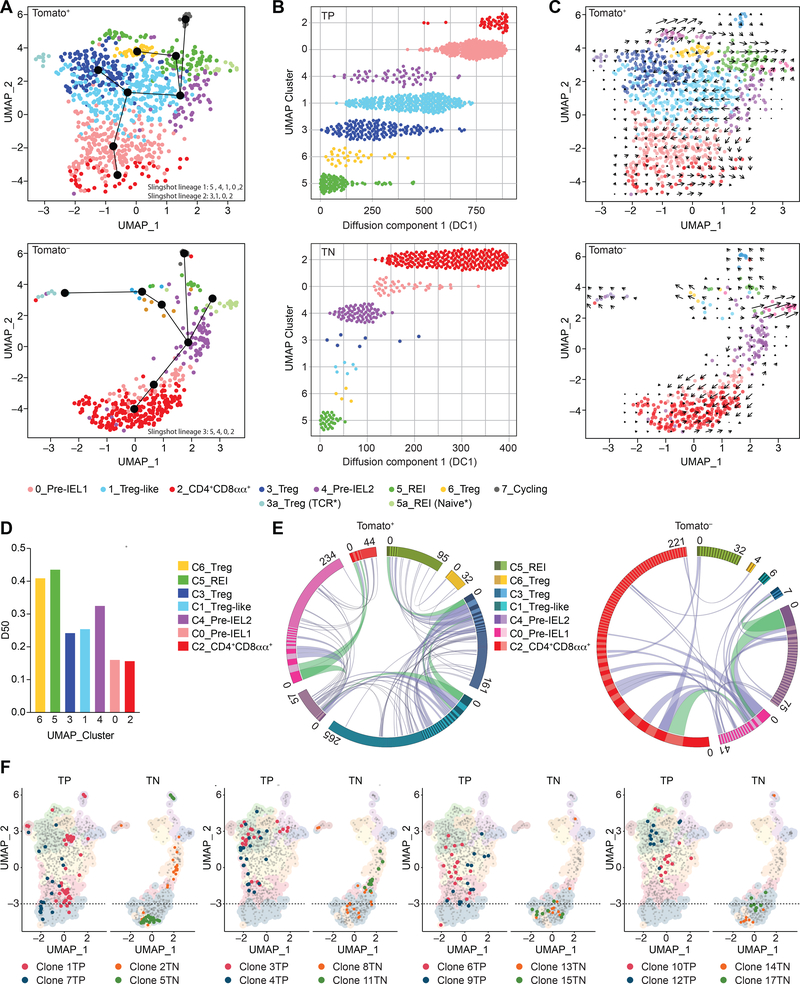
Figure 1. Clonal distribution of intraepithelial CD4+ T cells follows single-cell trajectories.
(A-F) Tomato+ (library 1) and Tomato− (library 2) CD4+ T cells from the intestinal epithelium (IE) of a iFoxp3Tomato mouse were sorted for scRNAseq. Cells clustered into 8 (C_0–7) populations, including sub-clusters (3a, 5a) and visualized by UMAP. Cluster names correspond to colors as indicated. (A) Slingshot pseudotime trajectory of Tomato+ (top) and Tomato− (bottom) cells on the UMAP. CD4+CD8αα+-specific slingshot lineages (black lines) depicted in differentiation order. White numbers indicate clusters. (B) Cells ordered along diffusion component 1, separated by clusters of Tomato+ (TP, top) and Tomato− (TN, bottom) cells. (C) RNA velocity analysis vectors (arrows) of Tomato+ (top) and Tomato− (bottom) cells on the UMAP. (D) Diversity 50 (D50) estimate based on paired αβTCRs. (E) Circos plot of paired αβTCR CDR3 sequences; clones ordered clockwise in decreasing size. Links denote clonal sharing between populations of adjacent clusters; clonal expansions of less than 10 cells in purple and at least 10 cells in green among Tomato+ (left) and Tomato− (right) cells. (F) Top expanded clones per Tomato+ (TP, red and blue) and Tomato− (TN, orange and green) cells. Dashed line marks top limit of CD4+CD8αα+ cluster 2. N=1 mouse, 1,294 sequenced cells. See also Figure S1, Table S1, S2.

