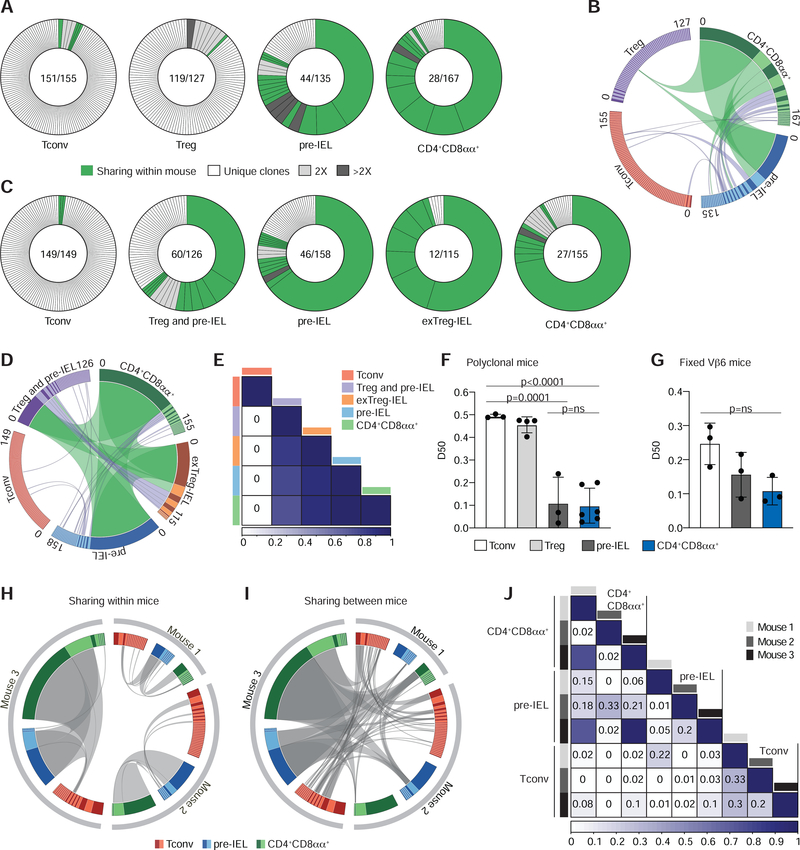
Figure 2. CD4+CD8αα+ IELs are clonally expanded with decreased TCR diversity.
(A-F) TCRβ and TCRα of single intestinal epithelium (IE) CD4+ T cells were sequenced via the MiSeq platform. (A, B) CD4+ conventional (Tconv; RFP−CD103−CD8α−), regulatory T cells (Treg; RFP+), pre-IEL (RFP−CD103+CD8α−) and CD4+CD8αα+ (RFP−CD103+CD8α+) from Foxp3RFPNur77GFP mice were analyzed. (A) αβTCR clonal diversity from 1 of 2 sequenced mice. Each slice represents a distinct αβTCR CDR3. Shared clones within each mouse in green, unique clones in white, and grey-scale represents expanded clones. Enclosed numbers indicate number of clones (numerator) and total number of cells (denominator). (B) Circos plot of paired αβTCR CDR3 sequences, with clones ordered clockwise in decreasing size. Links indicate clonal sharing between populations from 1 of 2 sequenced mice; clonal expansions of less than 10 cells in purple, and at least 10 cells in green. (C-E) CD4+ conventional (Tconv; Tomato− CD103−CD8α−), regulatory T cells mixed with Treg cells-derived pre-IELs (Treg and pre-IEL; Tomato+CD8α−), Tconv-derived pre-IELs (pre-IEL; Tomato−CD103+CD8α−), Treg cells-derived IELs (exTreg-IEL; Tomato+CD103+ CD8α+) and Tconv derived IELs (CD4+CD8αα+; Tomato− CD103+CD8α+) from Foxp3eGFP-cre-ERT2 x Rosa26lsl-tdTomato (iFoxp3Tom) mice were analyzed. (C) αβTCR clonal diversity from 1 of 2 sequenced mice. Label scheme as in (A). (D) Circos plot as in (B) of 1 of 2 sequenced mice. (E) Normalized Morisita-Horn index of paired αβTCR per population from 1 of 2 sequenced mice. (F) Diversity 50 (D50) estimate, pooled from all sequenced mice: Tconv (CD103−CD8α−), Treg cell (Foxp3RFP+ or Foxp3GFP+), pre-IEL (CD103+CD8α−), and CD4+CD8αα+ (CD103+CD8α+). (G-J) TCRα of Vα2+ Vβ6+ CD4+ T cells from three fixed-Vβ6 x Foxp3GFP mice were sequenced via the MiSeq platform as follows: Tconv (CD103−CD8α−), pre-IEL (CD103+CD8α−) and CD4+CD8αα+ (CD103+CD8α−). (G) D50 per population and mouse. (H, I) Circos plots as in (B) and (D) show clonal distribution and overlap of TCRα CDR3 sequences between populations within each mouse (private clones) (H) and sharing between mice (public clones) (I). Grey links denote clonal overlap. (J) Normalized Morisita-Horn index of TCRα per population and mouse. N=2 (A, B; C-E; F), N=3 (G-J). Significant p values as indicated [one-way ANOVA and Bonferroni (F, G)]. See also Figure S2 and Table S3.

