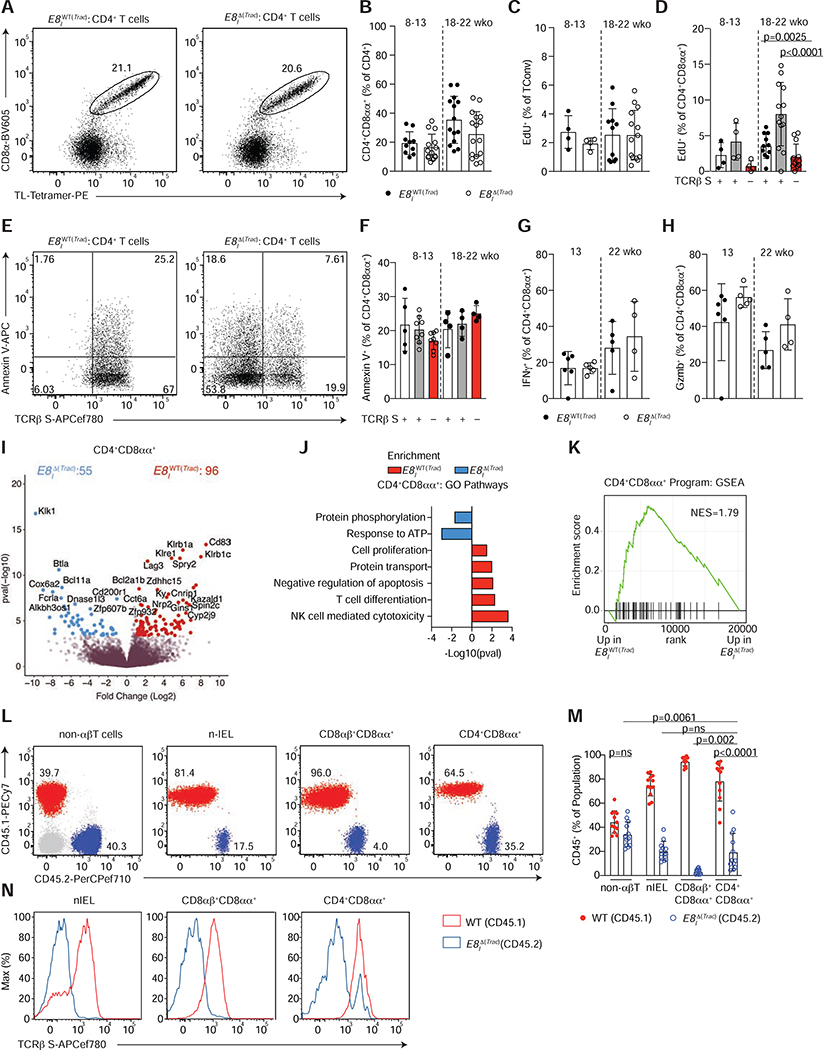
Figure 5. TCR signaling is not essential for CD4+CD8αα+ IEL maintenance.
(A-H) Flow cytometry analysis of intestinal epithelium (IE) of 8–22 week-old E8IWT(Trac) (Trac+/+ E8Icre+ or Trac+/+ E8Icre− or Tracf/f E8Icre−) or E8I Δ(Trac) (Tracf/f E8Icre+) mice, grouped by age. (A) Dot plots of surface CD8α and TL-Tetramer expression among CD4+ T cells in E8IWT(Trac) (left) or E8IΔ(Trac) (right) mice. (B) Frequency of CD4+CD8αα+ (CD8α+TL-Tetramer+) among CD4+ T cells in E8IWT(Trac) and E8IΔ(Trac) mice. (C, D) Proliferation frequency (measured by EdU incorporation) of CD4+CD8α−Foxp3− cells (C) among cells with or without surface TCRβ expression (D). (E, F) Annexin V expression among TCRβ sufficient and deficient CD4+CD8αα+ IELs. (E) Dot plots of Annexin V and surface TCRβ among CD4+CD8αα+ IELs in E8IWT(Trac) (left) or E8IΔ(Trac) (right) mice. (F) Frequencies of Annexin V+ cells among TCR sufficient and deficient CD4+CD8αα+IELs. (G, H) Frequencies of IFNγ (G) and granzyme B (Gzmb) (H) production upon PMA and ionomycin ex-vivo stimulation among CD4+CD8αα+s. (I-K) Bulk RNA-sequencing of TCRβ+ CD4+CD8αα+ IELs from E8IWT(Trac) and TCRβ− CD4+CD8αα+ IELs from E8IΔ(Trac) mice (n=3 per group). Volcano plot of differentially expressed genes between indicated populations (p<0.05, in color) (I), selected differentially-enriched gene ontology (GO) pathways between groups (J), and gene set enrichment analysis (GSEA) of CD4+CD8αα+ IEL program, defined by the top differentially-expressed genes in the CD4+CD8αα+ cluster in our single cell RNA-Sequencing from Figure 1 (K). (L-N) Flow cytometry analysis of bone marrow chimeras in sub-lethally irradiated Rag1−/− hosts reconstituted with 1:1 ratio of WT CD45.1+ and E8IΔ(Trac) CD45.2+ cells. Dot plots (L) and frequency (M) of WT CD45.1+ (red) and E8IΔ(Trac) CD45.2+ (blue) cells among non-αβT cells (γδT cells and non-T cells), natural IELs (nIEL, CD4−CD8αα+CD8β−TL-Tetramer+), CD8αβ+CD8αα+ cells (CD4−CD8αα+CD8β+TL-Tetramer+), and CD4+CD8αα+ IELs in the epithelium. (N) Histograms of surface TCRβ expression in WT CD45.1+ (red line) and E8IΔ(Trac) CD45.2+ (blue line) cells of indicated populations. Frequency data are expressed as mean +/− SEM (B-F). Significant p values as indicated [student’s t test (B, C, G, H) or one-way ANOVA and Bonferroni (D, F)]. n=10–16, 6 experiments in total (B), n=4–14, 2 experiments (C, D), n=5–8, 2 experiments (F) n=4–6, 2 experiments (G, H) and n=12, 3 independent experiments (M). See also Figure S5 and Tables S4–S6.

