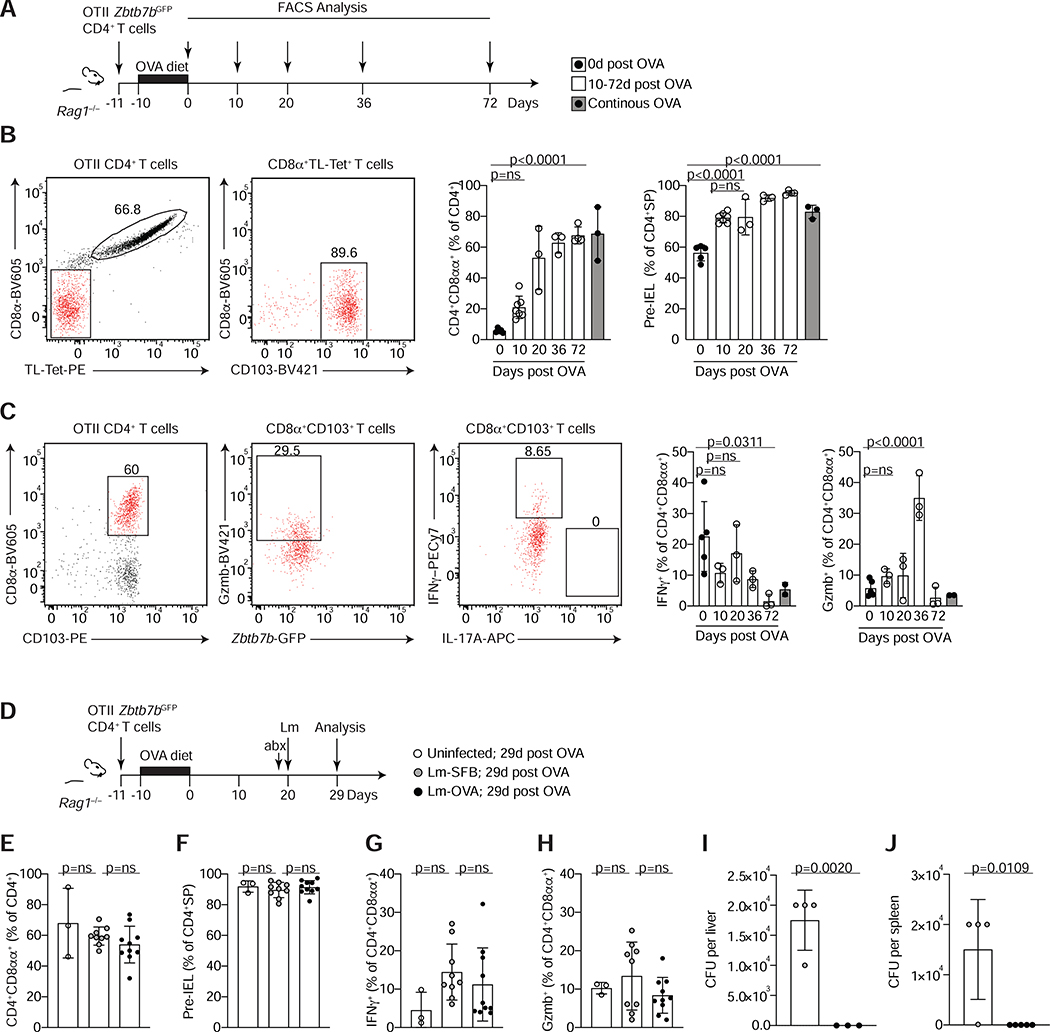
Figure 6. Cognate ligand interaction is dispensable for the maintenance of CD4+CD8αα+ IELs under steady state or after Listeria monocytogenes infection.
(A-C) Total splenocytes and lymph node cells from OTII Zbtb7bGFP Rag1−/− mice were transferred to Rag1−/− animals prior to ovalbumin (OVA) diet treatment and analyzed at different time points after OVA withdrawal as indicated. (A) Experimental layout. (B) Dot plots of surface CD8α and TL-Tetramer expression among total OTII CD4+ T cells (left) and of CD8α and CD103 expression among CD8β− CD4+ T cells (middle) 36 days after OVA removal. Graphs show frequencies of CD4+CD8αα+IELs among total OTII (Vα2+) CD4+ T cells (middle) and of pre-IELs (CD8α− CD103+) among CD4 single positive (CD4+SP) cells (OTII CD4+ CD8α−) (right) at indicated times after OVA removal in white and after continuous OVA diet for 30 or 82 days in grey bars. (C) Dot plots of surface CD8α and CD103 expression among total OTII CD4+ T cells (left), granzyme B (Gzmb) and Zbtb7b-GFP among CD4+CD8αα+ (CD103+CD8α+, middle) and IFNγ and IL-17A among CD4+CD8αα+ (right) 36 days after OVA removal and ex-vivo stimulation with PMA and ionomycin. Graphs represent frequencies of IFNγ and Gzmb production among CD4+CD8αα+ (CD8α+ CD103+) as in (B). (D-J) Rag1−/− animals were treated as in (A) and 20 days after OVA removal, animals were infected with Listeria monocytogenes expressing full length SFB protein 3340 or OVA (Lm-SFB or Lm-OVA, respectively) or were left uninfected. All mice were treated with streptomycin 24h prior to infection and analyzed 9 days after infection. (D) Experimental layout. (E) Frequencies of CD4+CD8αα+ among total OTII CD4+ T cells. (F) Frequencies of pre-IELs among CD4+SP cells. (G, H) Frequencies of IFNγ (G) and Gzmb (H) among ex-vivo PMA and ionomycin stimulated CD4+CD8αα+IELs. (I, J) Colony forming units (CFU) per liver (I) or spleen (J) 9 days post infection. Data are expressed as mean +/− SEM of individual mice (n=3–5, 2 experiments (A-C) and n= 3–9, 2 experiments (D-J)). Significant p values as indicated [student’s t test (I, J) or one-way ANOVA and Bonferroni (B, C, E-H)]. See also Figure S6.

