
Figure 2.
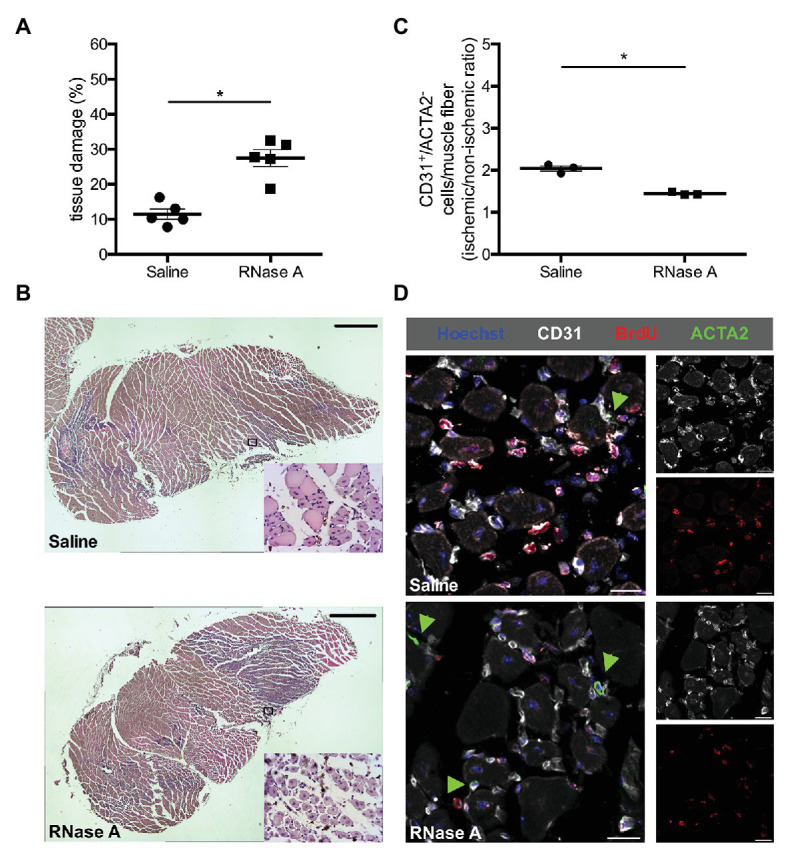
RNase A treatment results in decreased angiogenesis and increased tissue damage. (A) The scatter plot shows the percentage of tissue damage in the gastrocnemius muscle of mice treated with RNase A or saline (control group) 7 days after FAL. Data are means ± S.E.M., n = 5 per group, the whole cross-sectional area of the gastrocnemius muscle was analyzed per mouse. *p < 0.05 (RNase A vs. saline treated group) by unpaired student’s t-test. (B) Representative pictures of analyzed H and E stained gastrocnemius muscle of saline‐ (upper picture) or RNase A (lower picture) treated mice 7 days after FAL. After treatment with bovine RNase A, significant increased tissue damage can be seen becoming evident e.g., by skeletal muscle cells showing centralized nuclei (small magnifications right bottom). Scale bars 100 μm. (C) The scatter plot shows the CD31+/ACTA2− cells per muscle fiber (ischemic vs. non-ischemic tissue ratio, respectively) in the gastrocnemius muscle of RNase A or saline treated mice 7 days after the surgical procedure. Data are means ± S.E.M., n = 3 per group, 10 cross-sectional areas (450 μm × 450 μm each) of the gastrocnemius muscle were analyzed per mouse per leg. *p < 0.05 (RNase A vs. saline treated group) by unpaired student’s t-test. (D) Representative immunofluorescence pictures of analyzed gastrocnemius muscle tissue of saline‐ (upper picture) or RNase A treatment (lower picture) 7 days after FAL. Endothelial cells were labeled with anti-CD31 (gray), with anti-BrdU 546 (red), and Hoechst (blue). Pericytes, in addition, were labeled with anti-ACTA2 (green, and indicated by green arrowheads). Scale bars 20 μm.