
Figure 4.
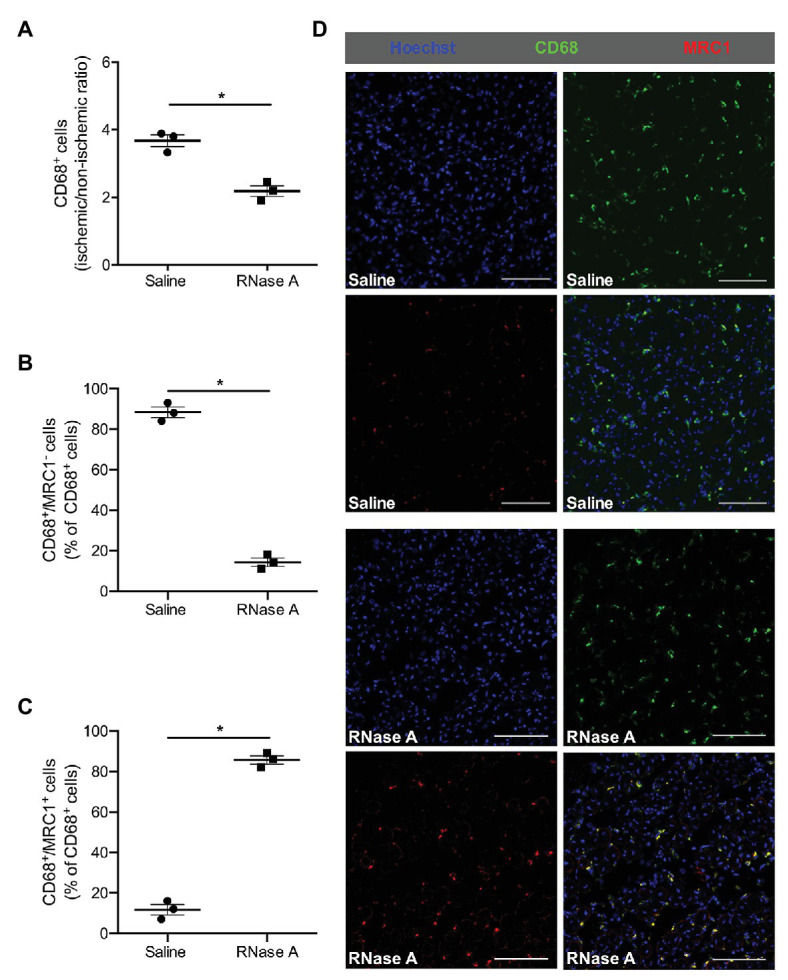
The effect of bovine RNase A on macrophage recruitment and polarization. The scatter plots show the ratio (ischemic vs. non-ischemic tissue) of (A) total CD68+ cells and the percentage of (B) CD68+/MRC1− and of (C) CD68+/MRC1+ cells of all CD68+ cells in the gastrocnemius muscle of RNase A or saline treated mice 7 days after the surgical procedure. Data are means ± S.E.M., n = 3 per group, 10 cross-sectional areas (450 μm × 450 μm each) of the gastrocnemius muscle were analyzed per mouse per leg. *p < 0.05 (RNase A vs. saline treated group) by unpaired student’s t-test. (D) Representative immunofluorescence pictures of analyzed gastrocnemius tissue of saline‐ (upper picture) or RNase A (lower picture) treated mice 7 days after FAL. Scale bars 100 μm.