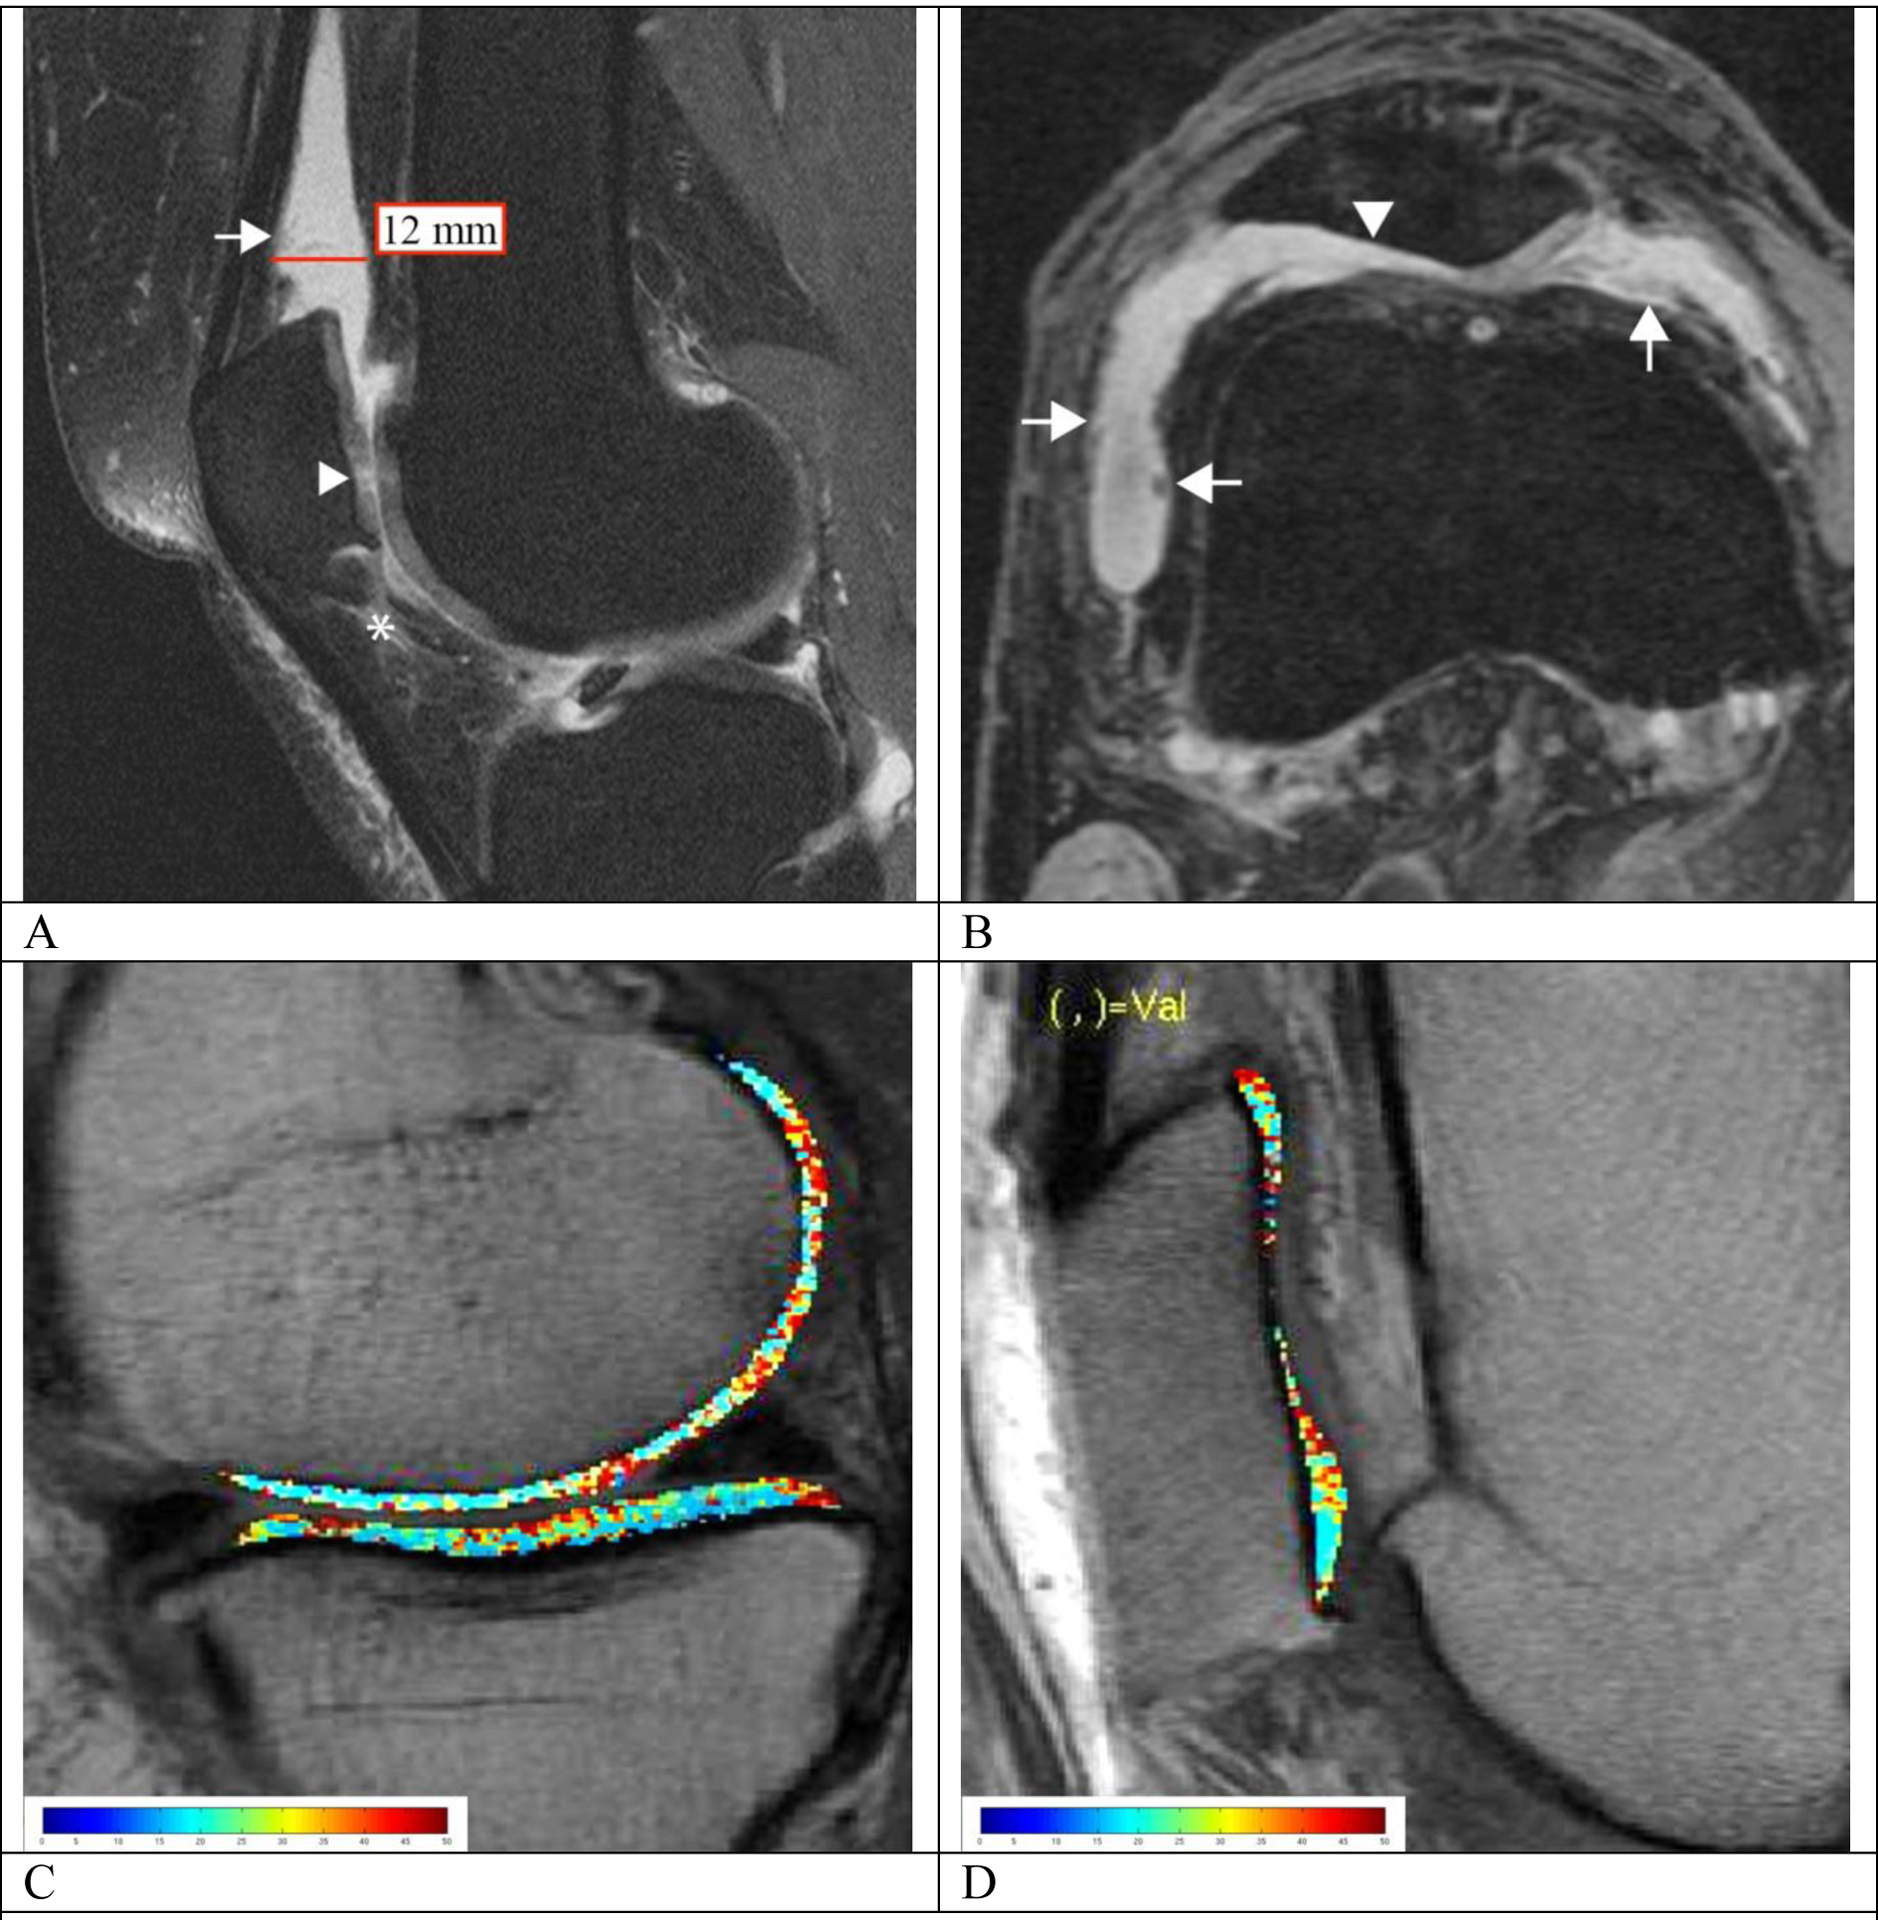
Fig. 2.

MRI-synovial inflammatory biomarkers (A, B) and representative T2 maps (C, D) in overweight and obese subjects. (A) Mid-sagittal intermediate-weighted fat-suppressed image of a 47-year-old obese woman (Total WOMAC pain subscale = 5) with focal increased signal intensity within the IPFP (grade 2 for signal which is equal to cartilage and grade 1 for size with less than 33% IPFP involvement; asterisk), effusion-synovitis in the suprapatellar recess (grade 3 according to ACLOAS) and mild irregularity of the synovium with synovial thickening (grade 2 for synovial proliferation score; arrow). There is focal cartilage loss at the patella (WORM score = 2.5; arrowhead). The T2 color map is shown in (C) which shows heterogeneously increased T2 relaxation time throughout the entire medial femoral condyle and tibia (41.13 and 35.93 ms, respectively). (B) Axial reformatted 3D DESS image of a 62-year-old overweight man (Total WOMAC pain subscale = 4) demonstrating irregular and villonodular synovial thickening (grade 3 for synovial proliferation score; arrow), and effusion-synovitis (grade 2 according to MOAKS). Full thickness cartilage loss at the lateral facet of the patella was also noted (WORMS = 6; arrowhead). The T2 color map demonstrates heterogeneously elevated mean T2 relaxation time (34.12 ms) throughout the entire patella, highest near the cartilage defects (D)
