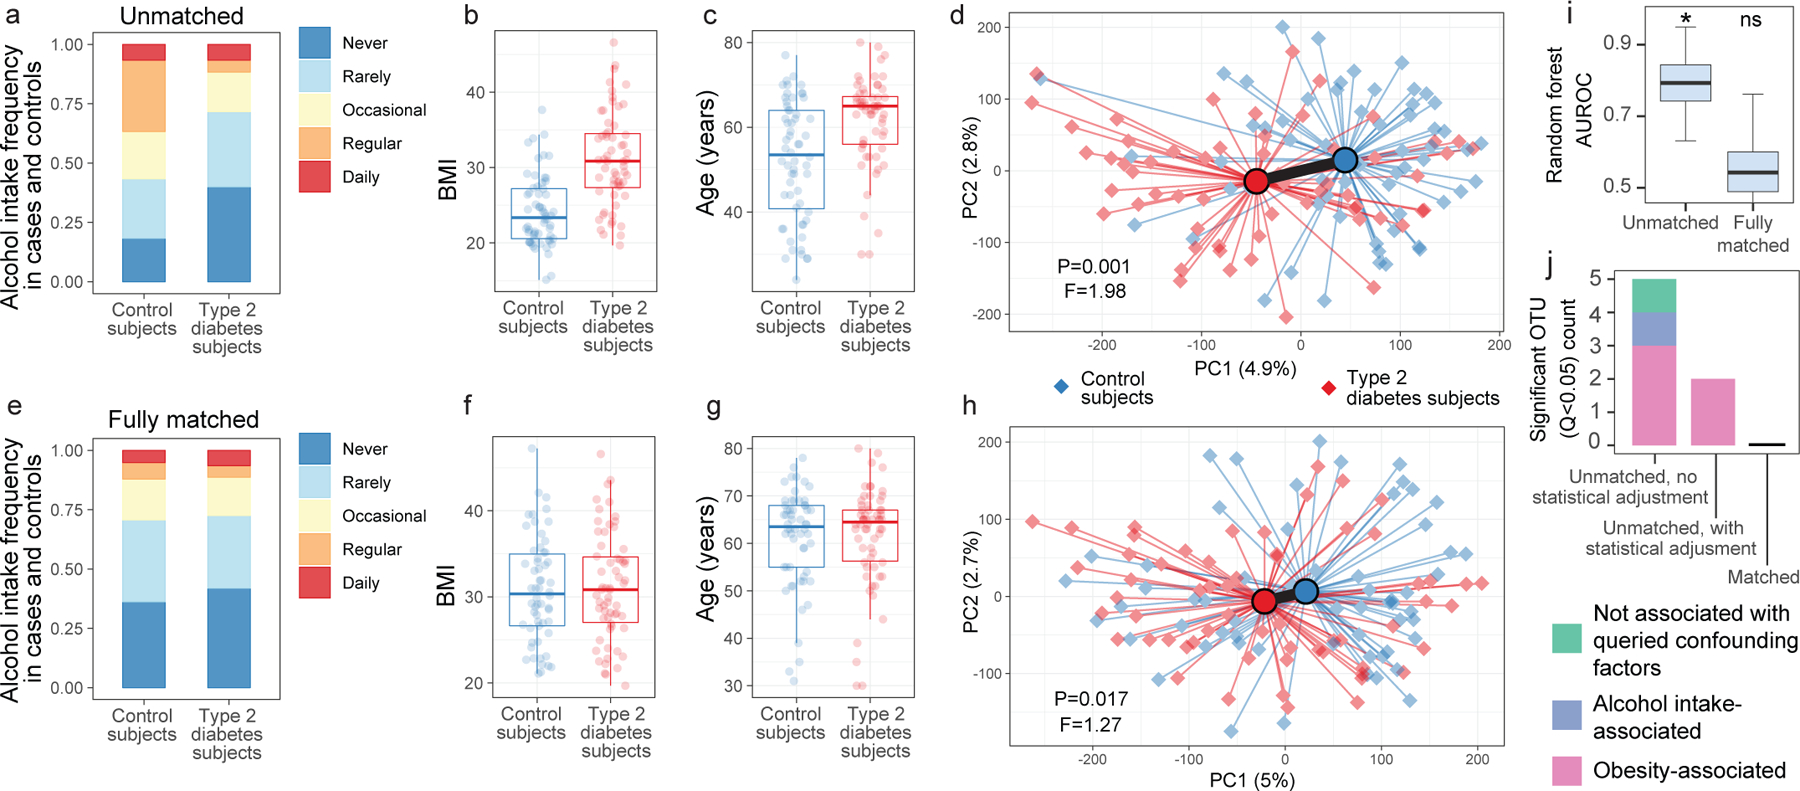
Figure 3: Microbiota variation due to confounding variables spuriously increases observations of disease-associated microbiota differences.

(A-C) Differences between type 2 diabetes subjects and non-diabetic control subjects (N=126) for alcohol frequency (Benjamini-Hochberg [BH] Q=0.0015, Fisher’s exact test) (A), BMI (BH Q=4.14*10−9, two-sided Mann-Whitney U test) (B), and age (BH Q=5.94*10−5, two-sided Mann-Whitney U test) (C). D) Principal coordinates analysis (PCoA) plot of diabetes cases and control subjects unmatched for aforementioned variables, with median PERMANOVA P value and F statistics shown. Subject group centroids are depicted by an outlined circle. (E-G) Differences between type 2 diabetes subjects and fully matched non-diabetic control subjects for alcohol frequency (E), BMI (F), and age (G). H) PCoA plot of confounder-matched diabetes cases and controls. I) Random Forest AUROC values for diabetes cases and controls before and after matching for confounding variables. J) Linear mixed effects models were constructed as described in Methods to include age, BMI, and alcohol intake frequency as confounding covariates. Shown are ASVs that passed BH Q values < 0.05 cutoffs for each analysis. Boxes denote inter-quartile range, black bar denotes median, and whiskers denote range.
