
Extended Data Figure 5: Machine learning and compositional analyses for diseases before and after confounder matching.
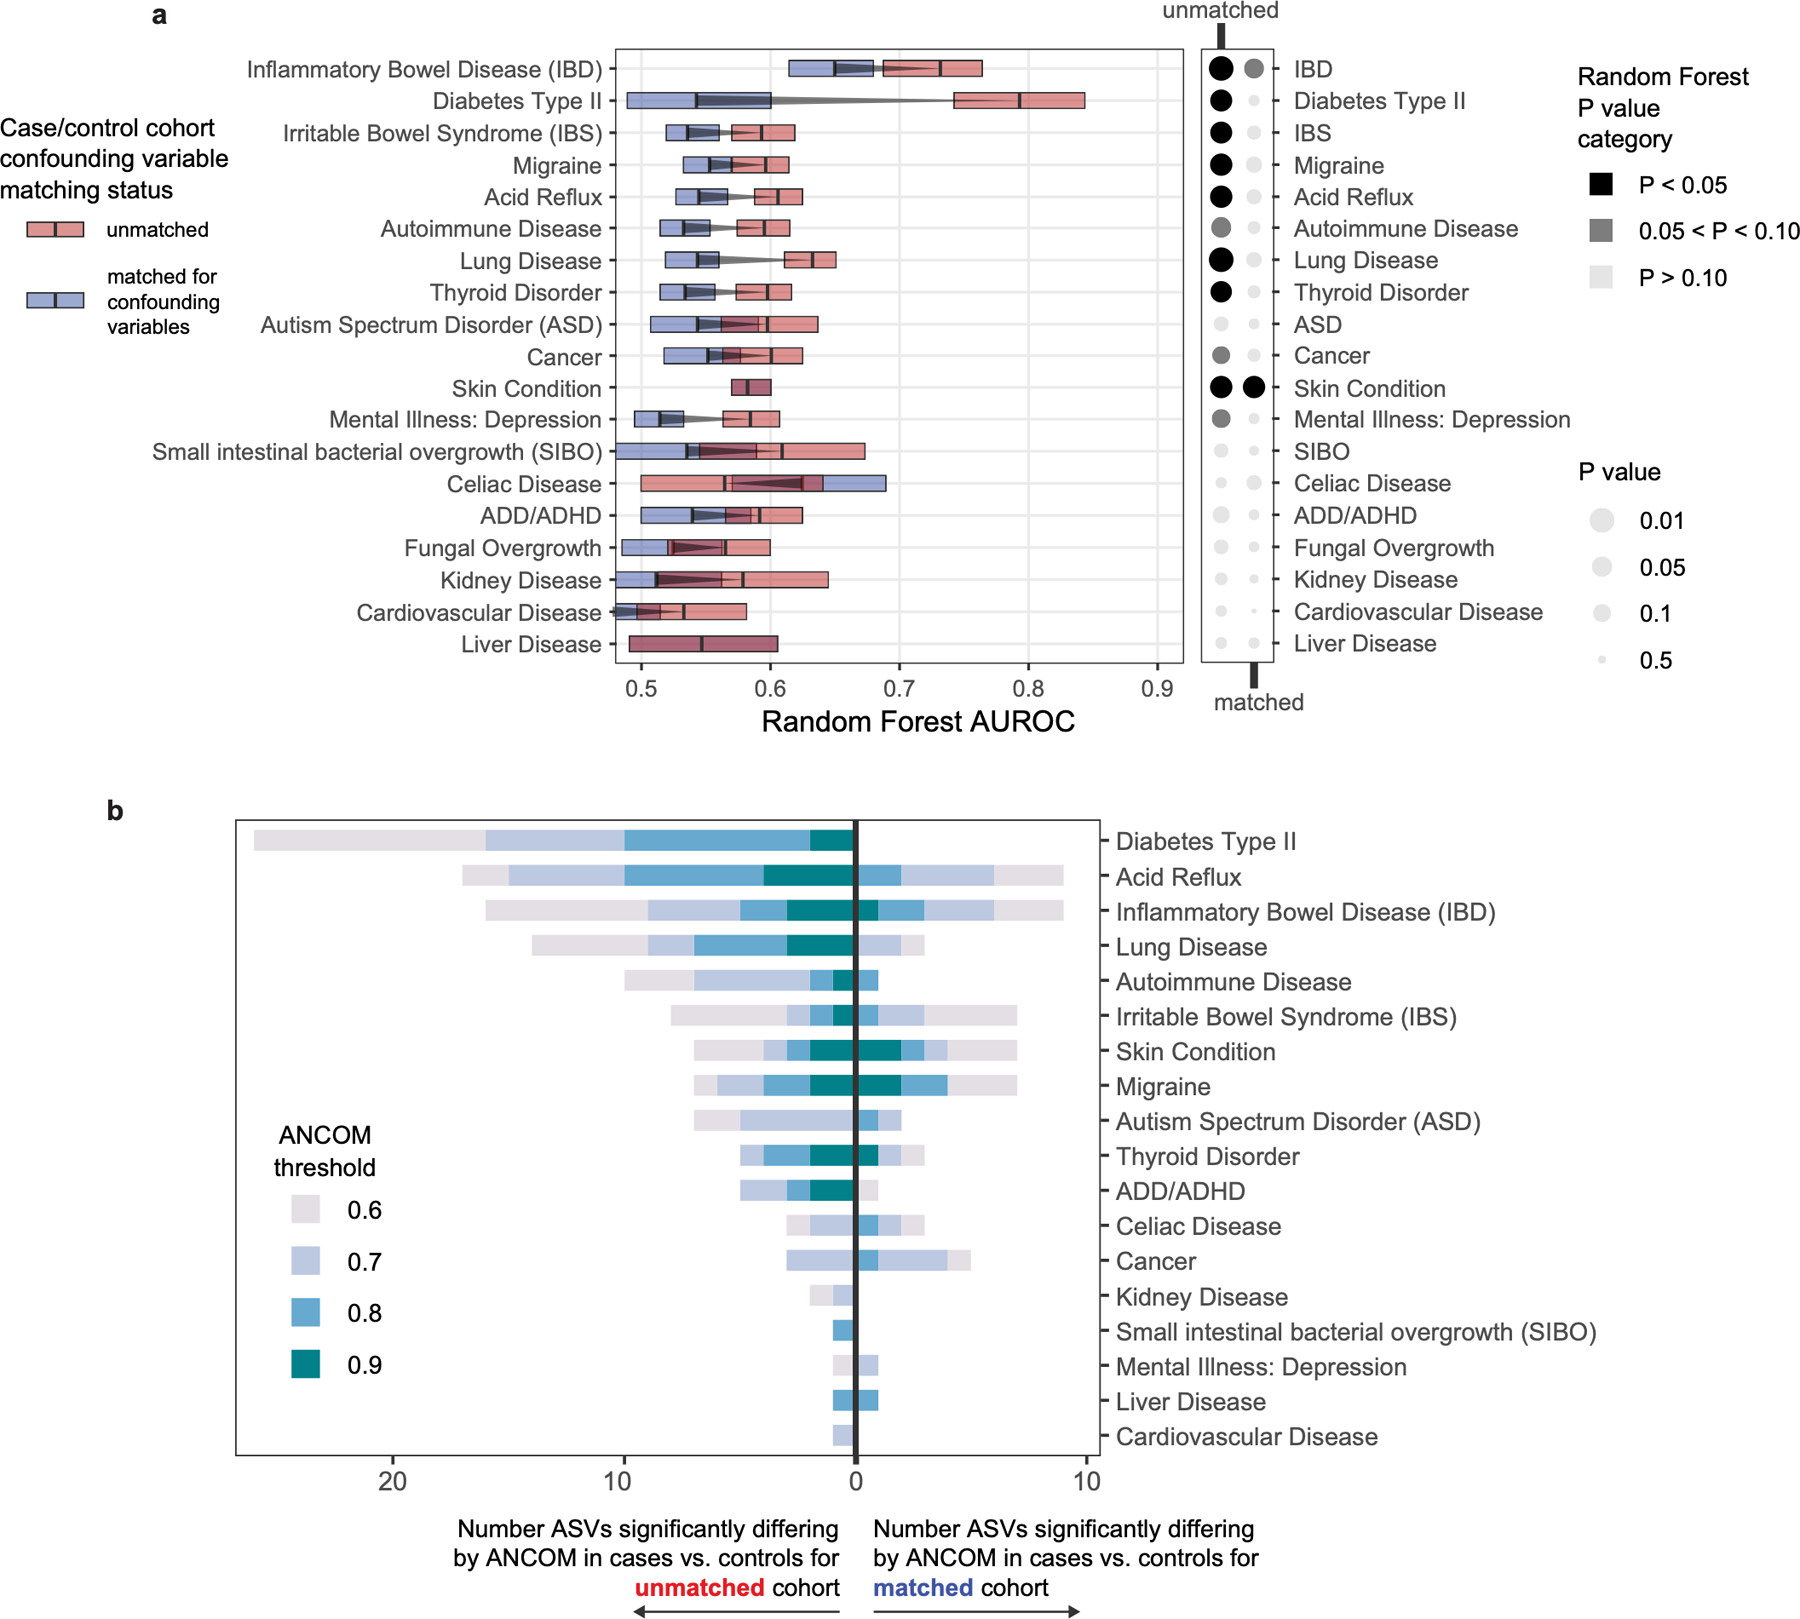
A) Matching cases and controls for key microbiota confounding variables substantially reduces observed microbiota differences between cases and controls, as assessed by machine learning methods. Random Forests analysis was performed as in Figure 2 on location-paired unmatched case control cohorts (red boxes) and case control cohorts matched for confounding variables shown in Figure 2 (blue boxes). Empirical P value significance based on comparison of AUROCs to permuted ‘shuffled’ data was calculated as described in methods. Boxes represent interquartile ranges in 100-repeat mean AUROC values per matched/unmatched condition. Center lines within boxes represent median AUROC values. B) Numbers of differentially abundant ASVs in disease cases versus controls before and after matching cohorts for confounding variables. ANCOM W score thresholds were calculated and ASVs are shown that met each threshold. Notably for type 2 diabetes, 26 ASVs differed significantly before matching, while zero ASVs differed post-matching.