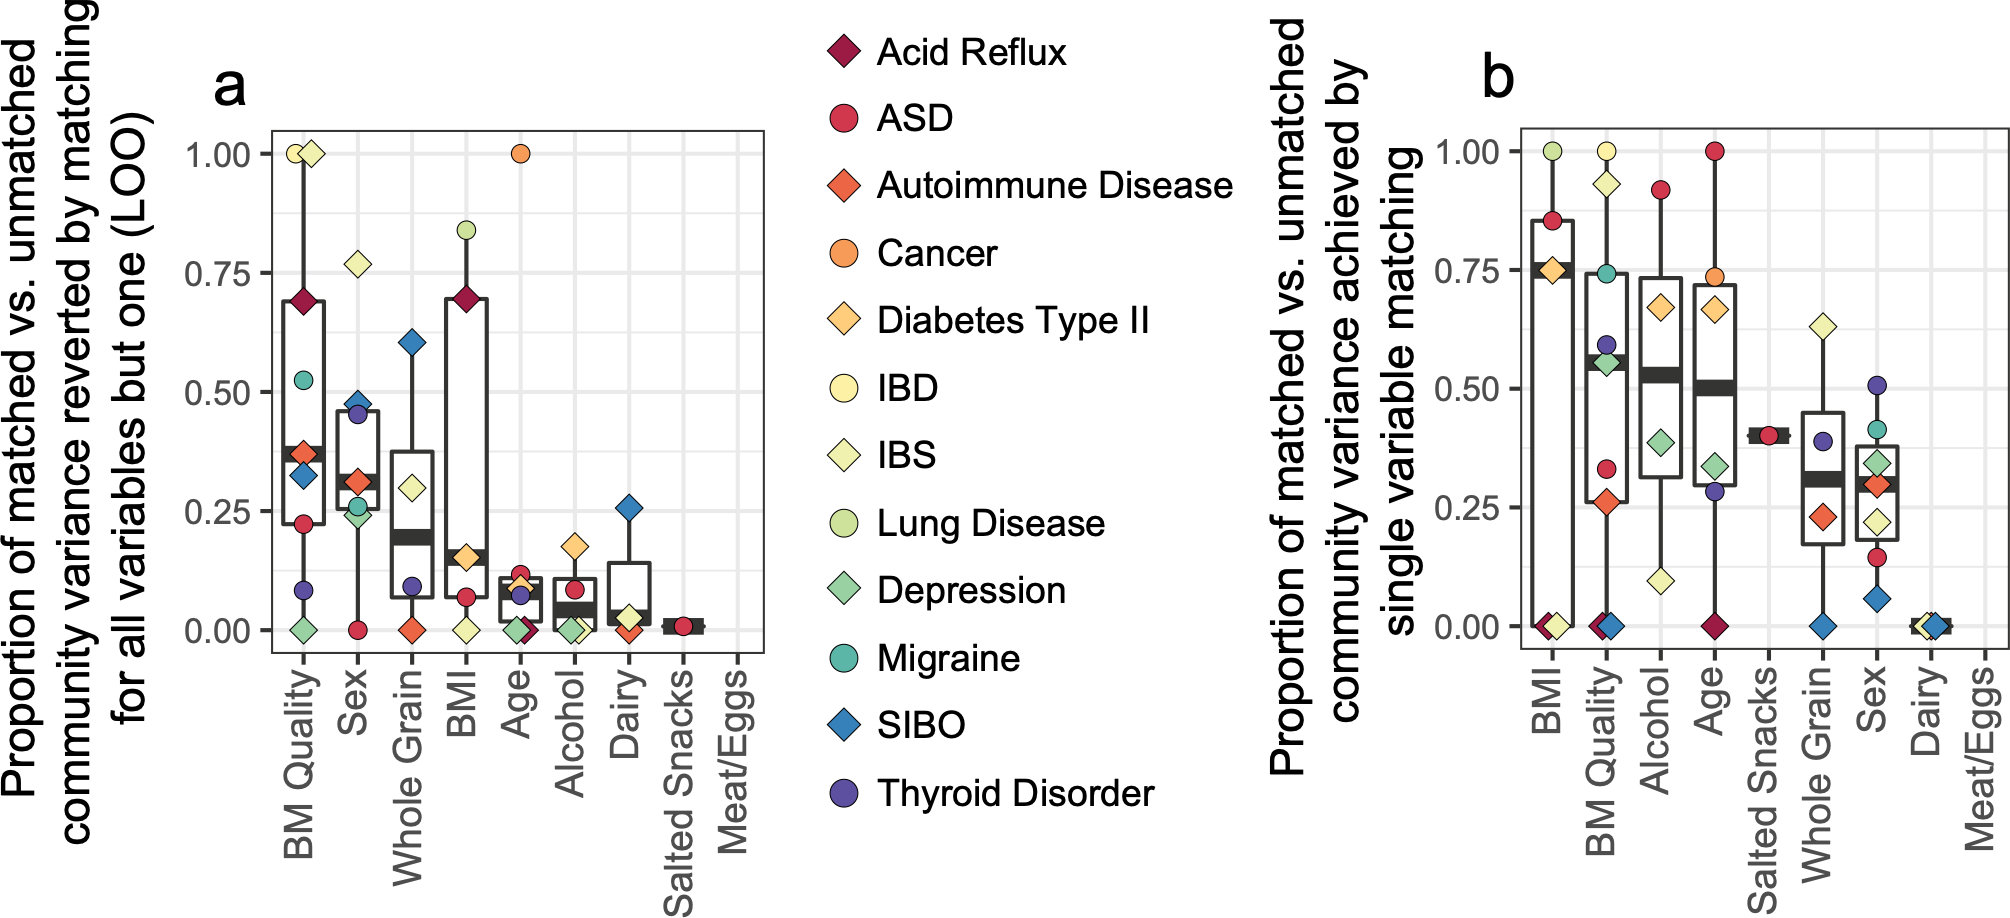
Extended Data Figure 8: Assessment of strength of confounding effects for microbiota-associated confounding host variables.

A) Cases and controls were matched for all relevant matching variables except one that was held out (‘leave one out’ [LOO]). The impact of the single variable held out was then assessed by comparing the increase of PERMANOVA F statistic between cases and controls to that of the total change in F statistic from fully matched to unmatched case-control cohorts. Thus, an assessment for the relative independent contribution of each variable to confounding effects in the setting of matching for all other variables was obtained for each variable for each disease. B) Matching by a single variable was performed and resulting F statistics were similarly compared to the difference in F statistics from unmatched to fully matched cohorts, as described in Methods. In A and B, center lines represent median values, boxes denote interquartile ranges, and whiskers denote 1.5*interquartile ranges.
