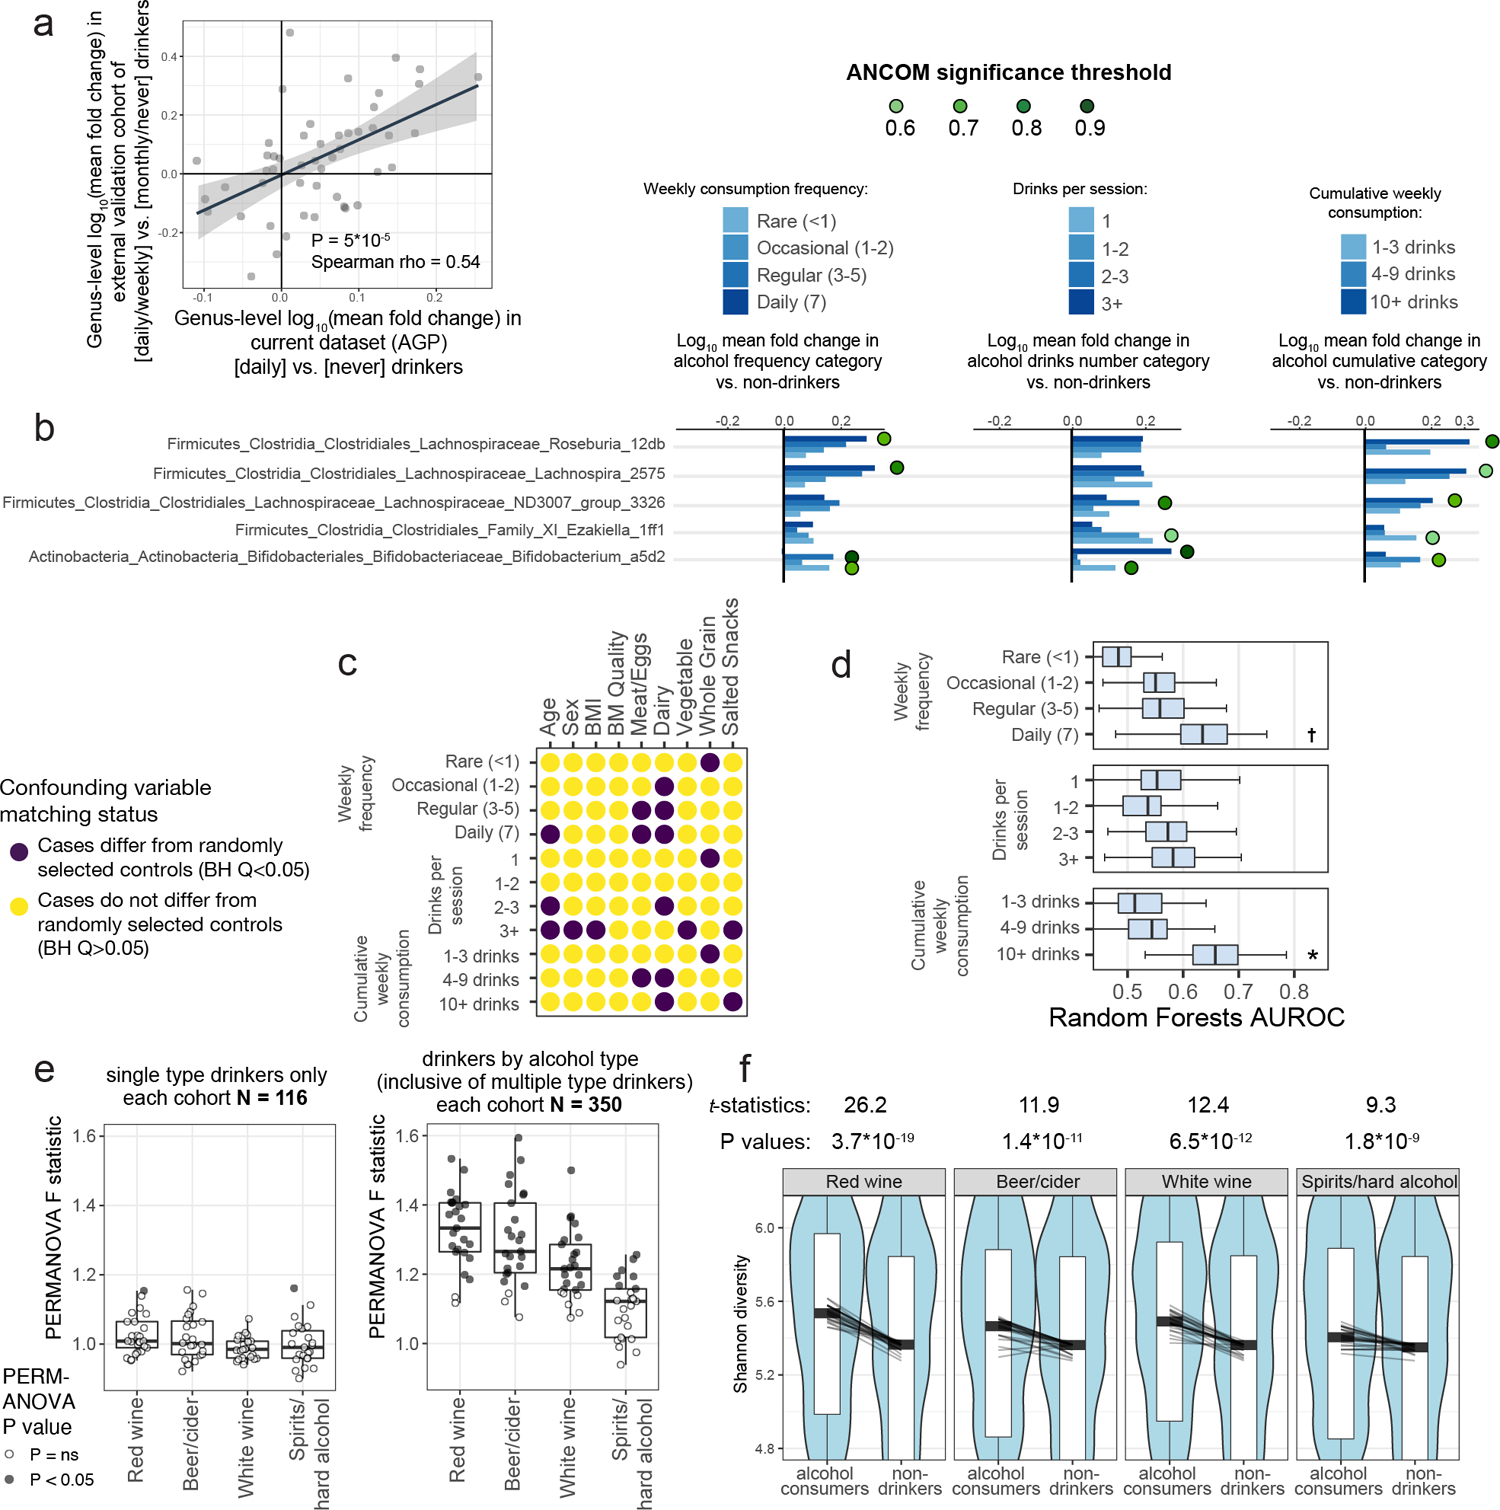
Extended Data Figure 9: Examination of effects of alcohol consumption on the gut microbiota with external validation.

A) ASV abundances were collapsed to the genus level and log10 mean fold changes were calculated between daily versus never drinkers in the AGP dataset (x axis) and compared to log10 mean fold changes in daily/weekly versus monthly/never drinkers in an external validation dataset (y axis). Spearman correlation test P = 10−4 B) ASVs in differential abundance in all alcohol consumer cohorts compared to matched control non-drinker subjects, by ANCOM. Matched cohorts were constructed by selecting controls matched for all confounding variables and ANCOM was performed. ASVs found to differ significantly between cases and controls are marked by green circles and denoted by their ANCOM threshold. C) Alcohol consumption frequency, number per session, and cumulative weekly consumption are confounded for various microbiota-associated host variables. D) Microbiota covariate association strength as estimated by Random Forests empirical P value tests for alcohol consumption cohorts. Alcohol subjects were matched to never-drinker controls for confounding variables shown in Extended Data Figure 9A and Random Forests analysis was performed as in Figure 2. Bars denote interquartile ranges of AUROCs from 100 repeats. Empirical P=0.0739, P=0.0495. E) Subjects reporting drinking only one type of alcohol (beer/cider, red wine, white wine, or spirits/hard alcohol), were compared to non-drinkers matched for variables shown in (C). Cohort sample sizes were increased when including drinkers who consumed multiple types, and significant median PERMANOVA P values were observed: P=0.004, P=0.007, P=0.021, P=0.076. In D and E, center lines represent median values, boxes denote interquartile ranges, and whiskers denote 1.5*interquartile ranges. F) Alpha diversity was calculated for subjects reporting consumption of each alcohol type (inclusive of those who also drink other types). Lines depict differences in median alpha diversity between cases and controls for each of the 25 re-sampled case-control cohorts. Unadjusted two-sided paired Student’s t-tests were performed. † P ≤ 0.10, *P ≤ 0.05.
