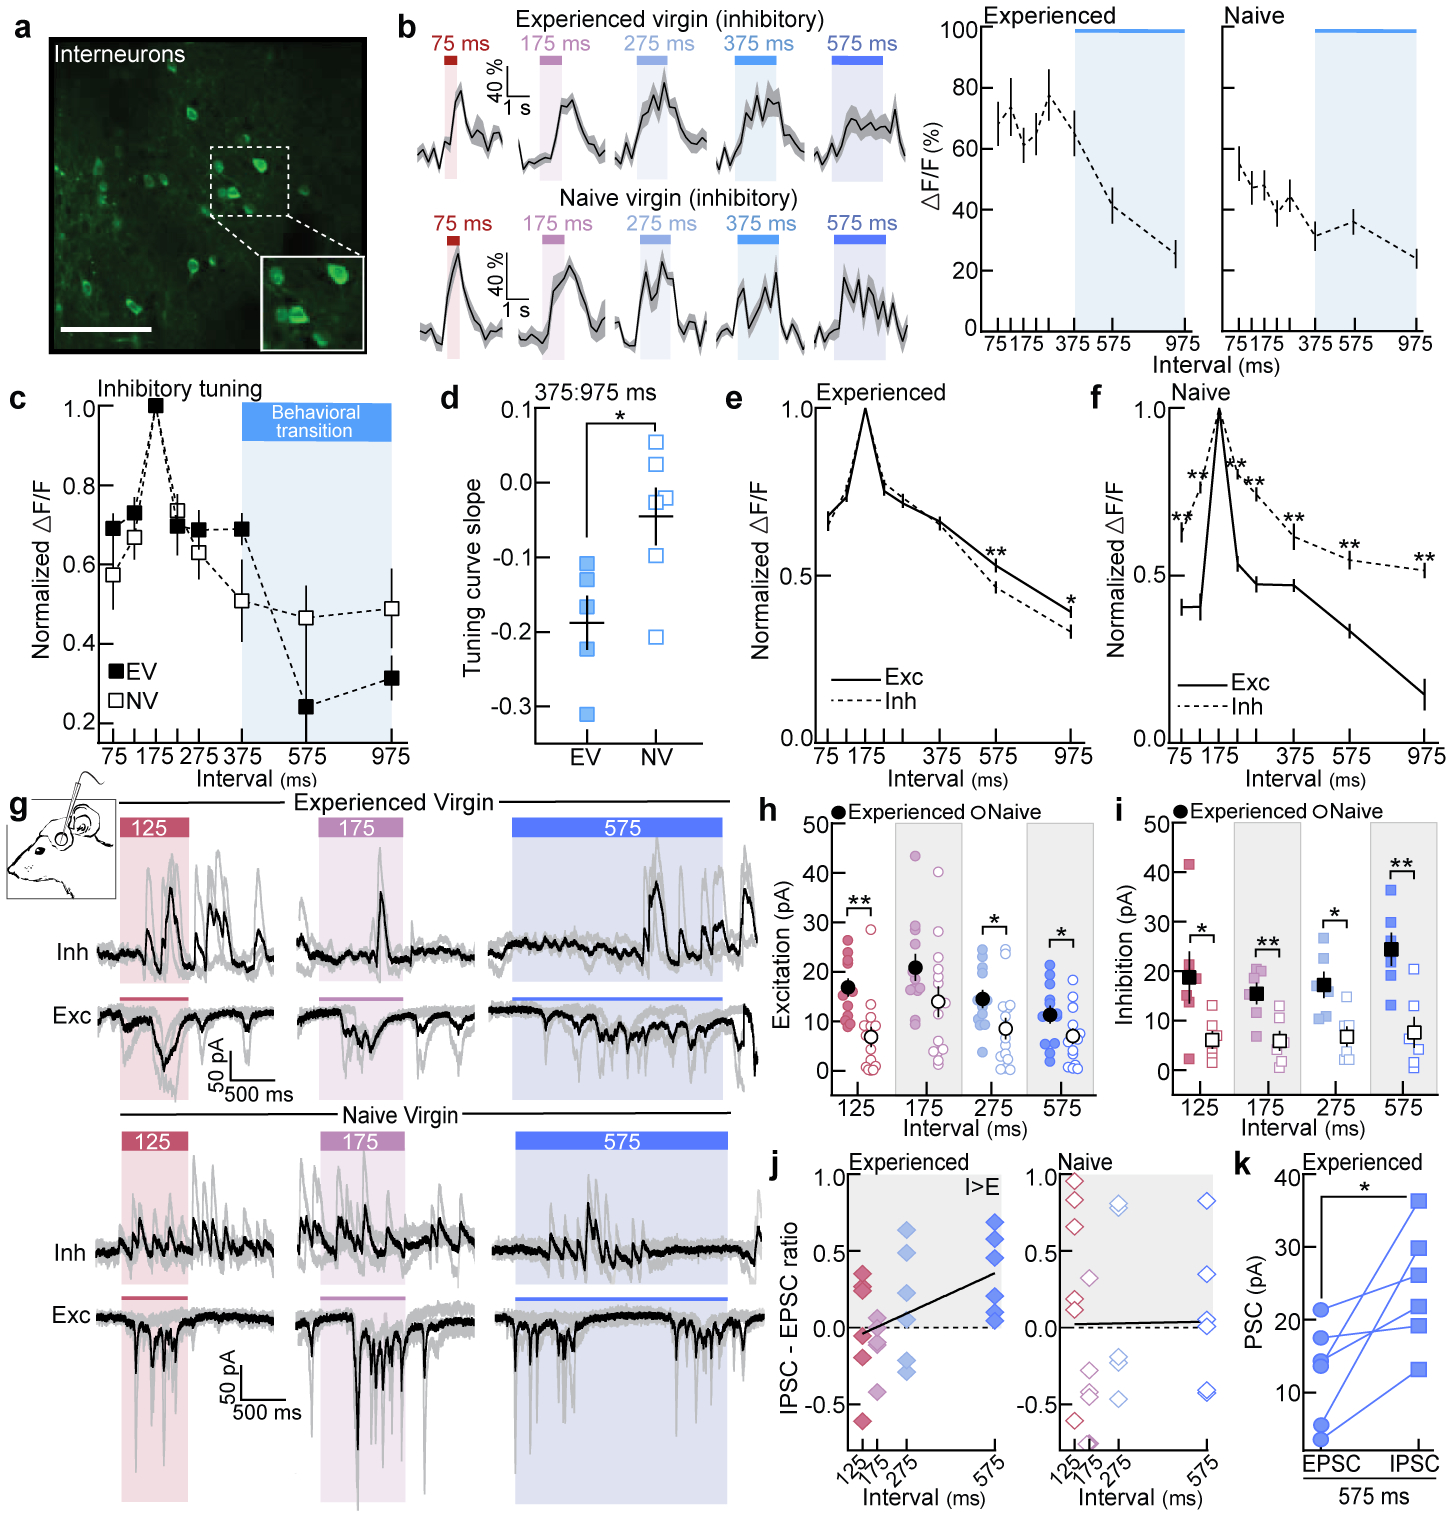
Figure 2. Excitatory and inhibitory tuning and synaptic responses are altered by maternal experience.

a, GCaMP6f in interneurons. Scale, 75 μm. b, Example ΔF/F traces and quantification. Blue shading, behavioral transition from Fig. 1c. c, Normalized inhibitory temporal tuning (EV: N=5 mice, NV: N=6). d, Tuning curve slopes from (c) (375:975 ms, p=0.03; unpaired two-tailed t-test). e, Temporal tuning across neurons in EVs (exc: n=366 single-cell tuning curves, inh: n=260; 575 ms, p=0.009; 975 ms, p=0.048). f, Same as (e) for naive cortex (exc: n=268, inh: n=128). g, In vivo voltage-clamp recordings from auditory cortical neurons. h, Prototype- and morph-evoked EPSCs in experienced (n=12 cells) and naive cortex (n=14) (125, p=0.001; 275, p=0.03; 575, p=0.04; unpaired one-tailed t-test). i, Prototype- and morph-evoked IPSCs (n=6 cells each; 125, p=0.047; 175, p=0.009; 275, p=0.01; 575, p=0.004; unpaired two-tailed t-test). j, Correlation of IPSC-EPSC ratio with ISIs in experienced (left, n=6 cells; Pearson’s r=0.47, p=0.02) and naive cortex (right, n=6; Pearson’s r=0.01, p=0.96; two-tailed). k, Within-cell comparison of 575-evoked PSCs in experienced cortex (n=6 cell; p=0.03; paired two-tailed t-test). Data shown are mean±s.e.m.; Stats: one-way ANOVA, Bonferroni correction for c,e,f; *p<0.05, **p<0.01.
