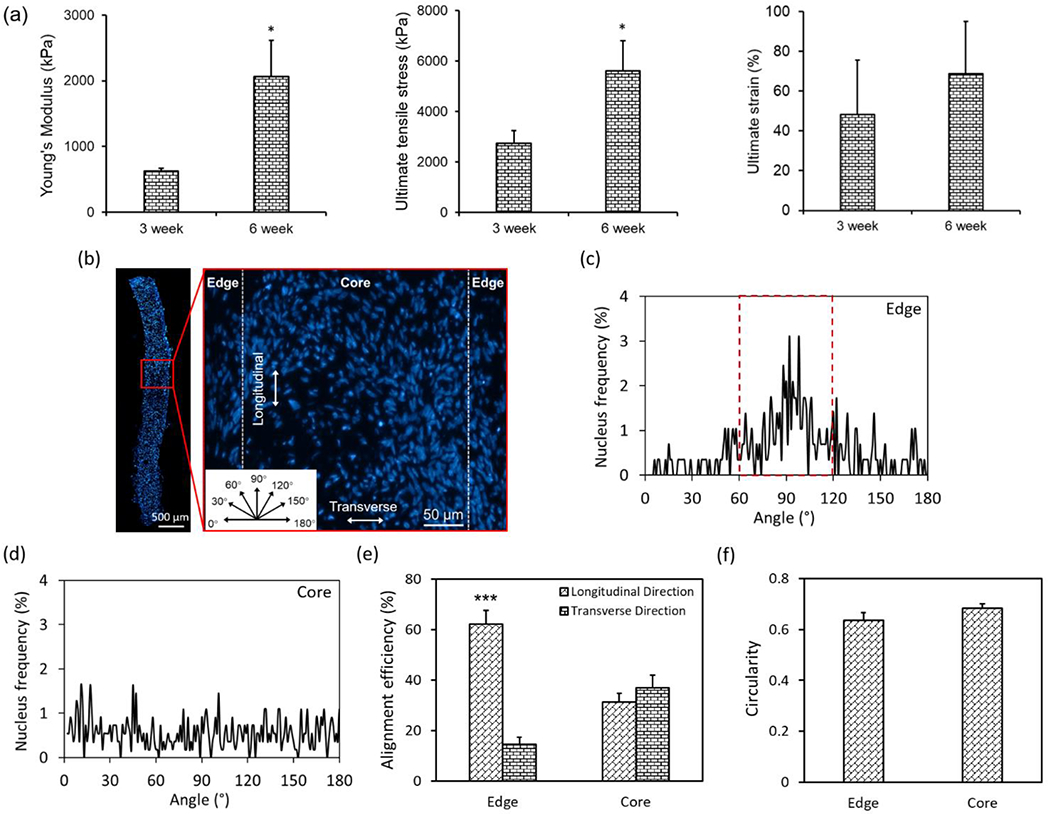
Figure 4.

Quantification of mechanical properties and cellular alignment and orientation within TSs in Group 1. (a) Comparison of mechanical properties of TSs in Group 1 after 3 and 6 weeks of culture (n=3, *p < 0.05). (b) A fluorescent image showing nuclei distribution throughout the histological section of a TS in Group 1 after 3 weeks of culture, which was divided into two regions (edge and core) based on the distance to edges (insert: angular orientation, which was used to define the nucleus angle). (c-d) Analysis of nucleus angle frequency at two regions. (e) Quantitative analysis of nucleus alignment efficiency and (f) circularity (n=4; ***p < 0.001).
