
Extended Data Fig. 5 |. Density maps and atomic models of Tri1 (a), Tri2a (b) and Tri2b (c).
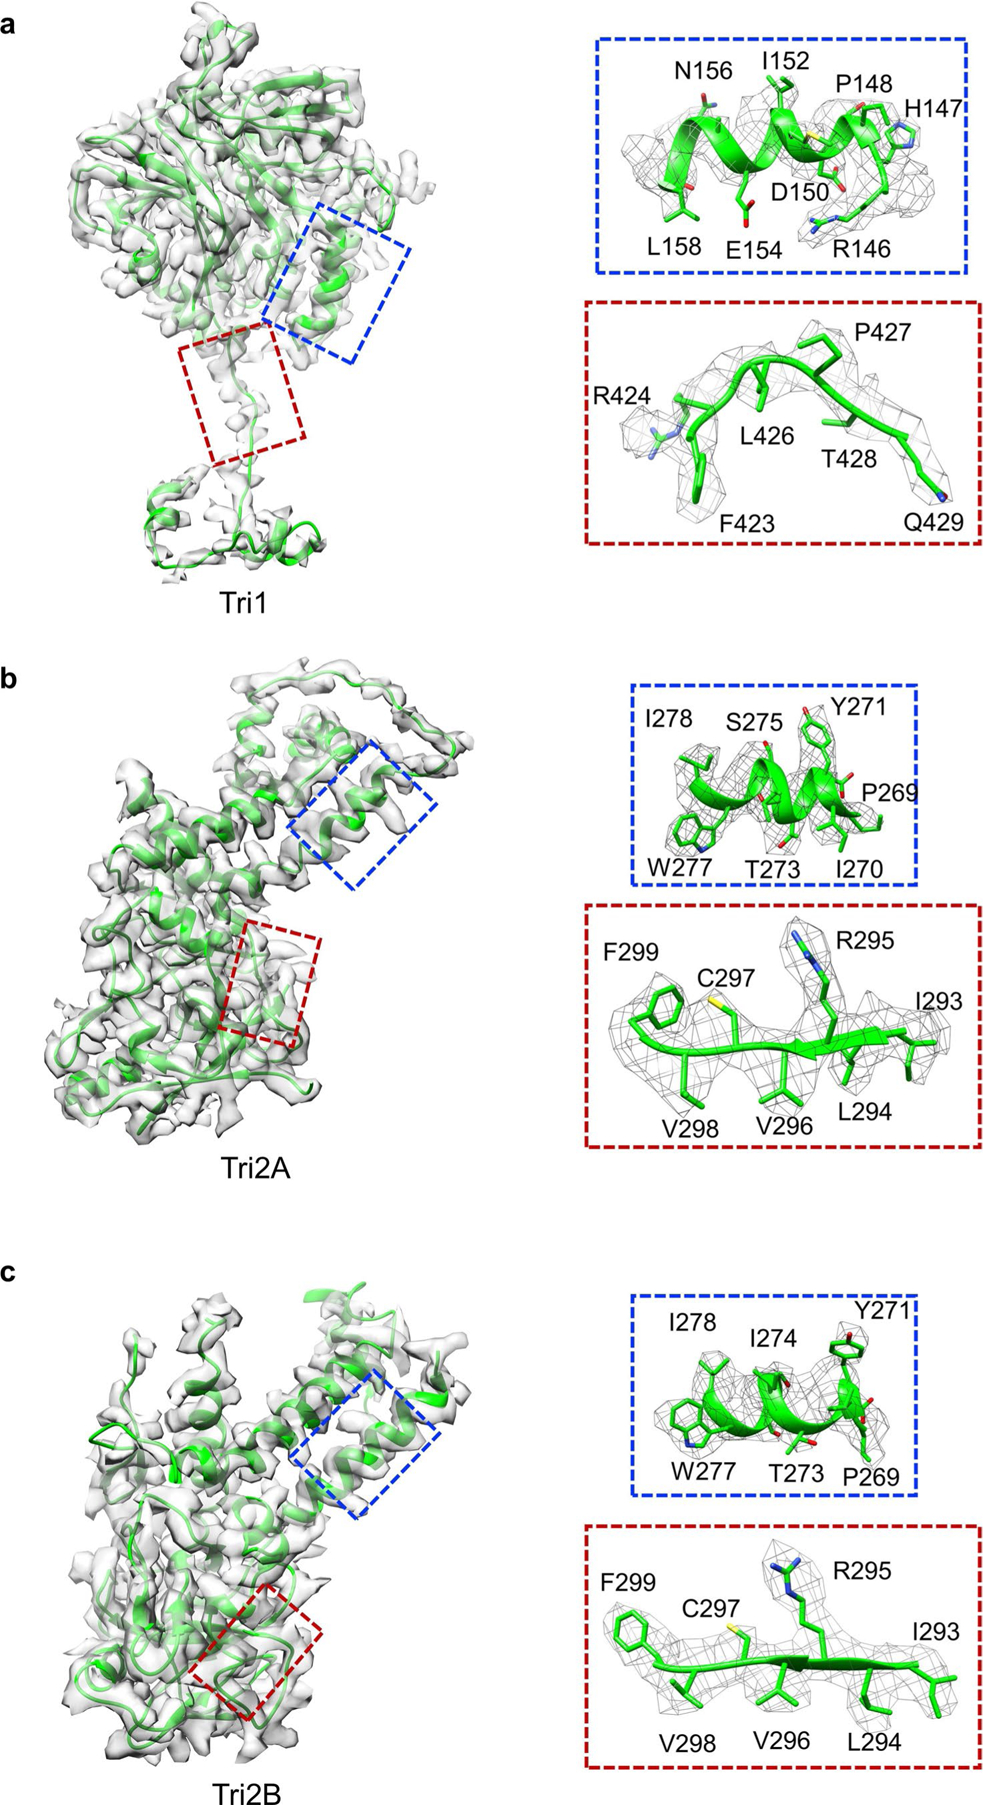
Insets correspond to zoomed-in views of boxed regions and illustrate residue features in the density map (mesh).
Official websites use .gov
A
.gov website belongs to an official
government organization in the United States.
Secure .gov websites use HTTPS
A lock (
) or https:// means you've safely
connected to the .gov website. Share sensitive
information only on official, secure websites.
Insets correspond to zoomed-in views of boxed regions and illustrate residue features in the density map (mesh).