
Extended Data Fig. 4 |. Density maps and atomic models of MCP and SCP.
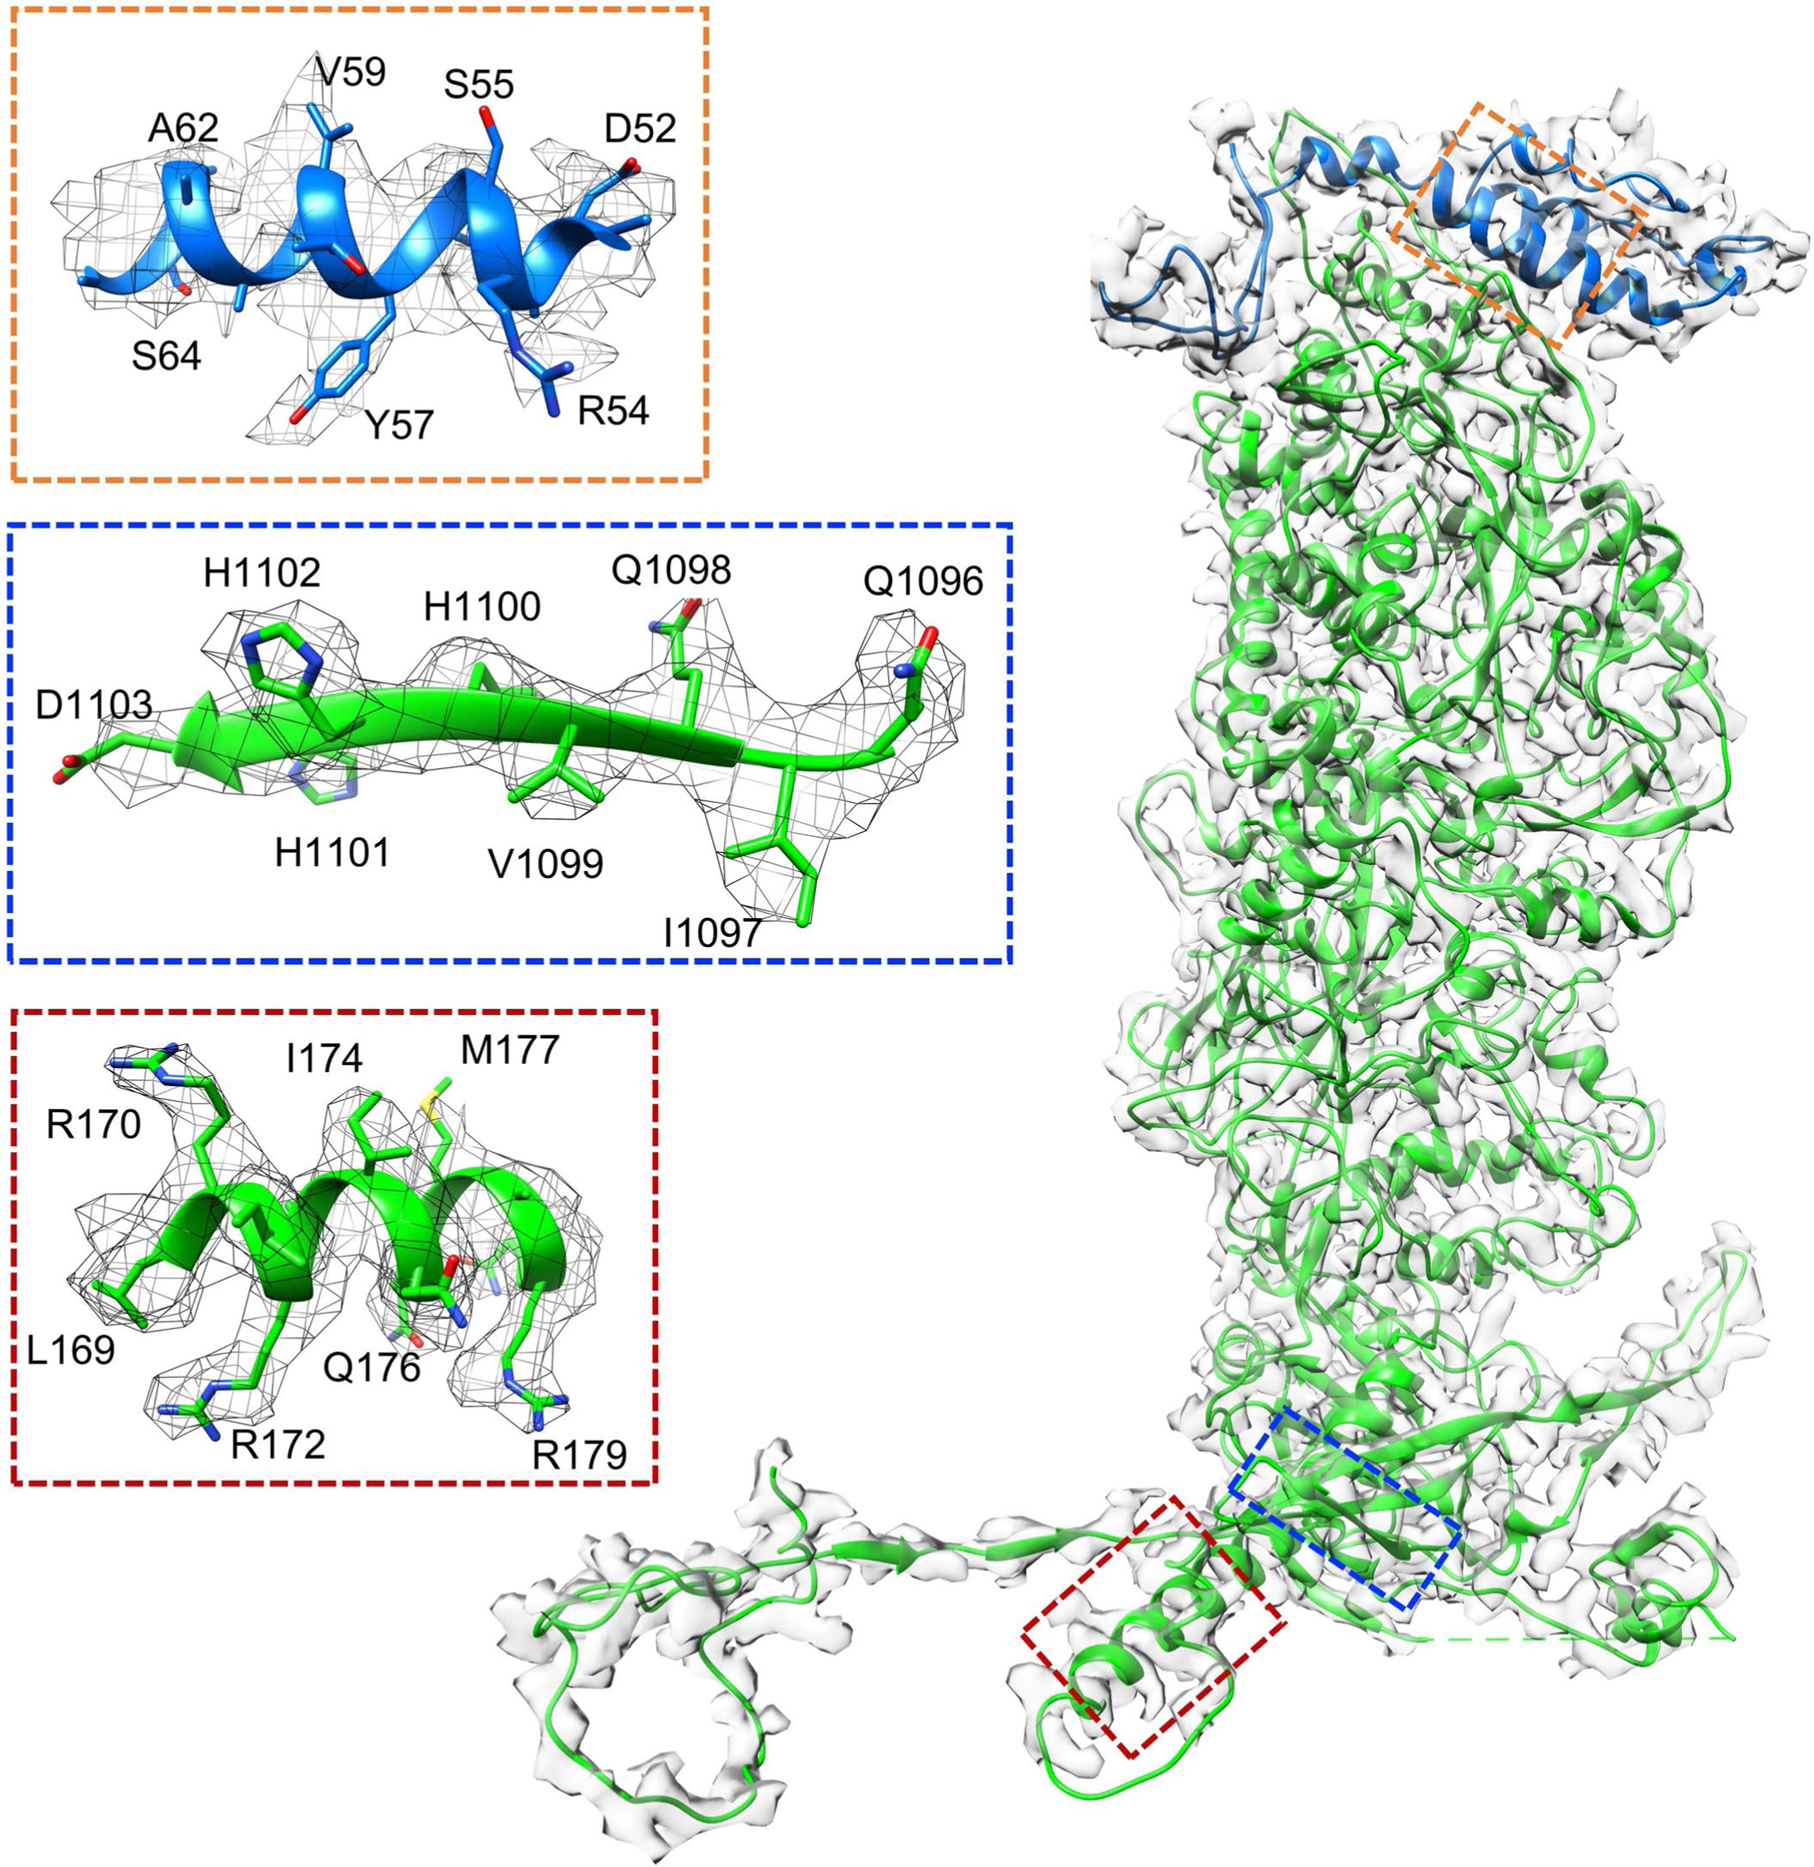
The fitted models of MCP and SCP are colored in green and blue, respectively. Insets correspond to zoomed-in views of boxed regions and illustrate residue features in the density map (mesh).