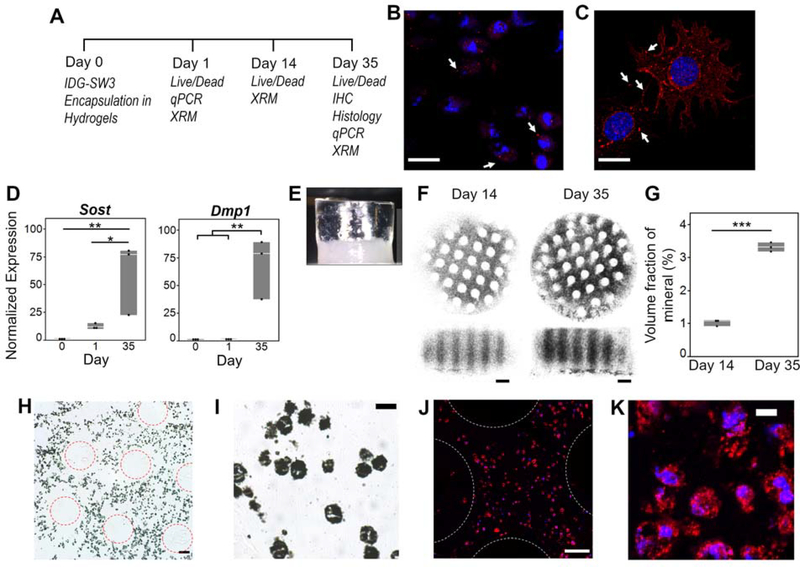
Figure 2. IDG-SW3 cells differentiated towards mature osteocytes and deposited bone matrix within the bilayer composite hydrogel.
(A) Study design and corresponding assays at each time point. (B-C) Representative confocal microscopy images of Connexin 43 (red, denoted with arrows) counterstained with DAPI for nuclei (blue) on (B) day 35 within hydrogel by immunohistochemistry and (C) day 3 on collagen type I coated glass dish by immunocytochemistry, scale bar = 20 μm. (D) Normalized gene expression (to Day 0) of osteocyte-marker genes Dmp1 and Sost on Days 0 (pre-encapsulated cells), 1, and 35 (n=3). (E) Photograph of bilayer composite at Day 35 depicting a translucent cartilage layer and opaque bone layer. (F) Representative 3D X-Ray Microscope (XRM) images show mineralization (black) on days 14 and 35. At day 1, there was no detectable mineral content and hence an image was not included. (G) Volume fraction of mineral content from the XRM images (n=3). (H-K) Representative images of day 35 Glycol methacrylate-embedded sections stained with von Kossa for mineralization (black) (H-I) and for collagen type I (red) and counterstained with DAPI for nuclei (blue) (J-K). Scale bar = 100 μm (H, J), 20 μm (I), 10 μm (K). In (H) and (J) 3D-printed pillar regions are outlined with dotted circles. Symbols denote significance from post hoc Tukey’s test (D) or two-sided t-test (G): * p<0.05; **p<0.01; ***p<0.001.

