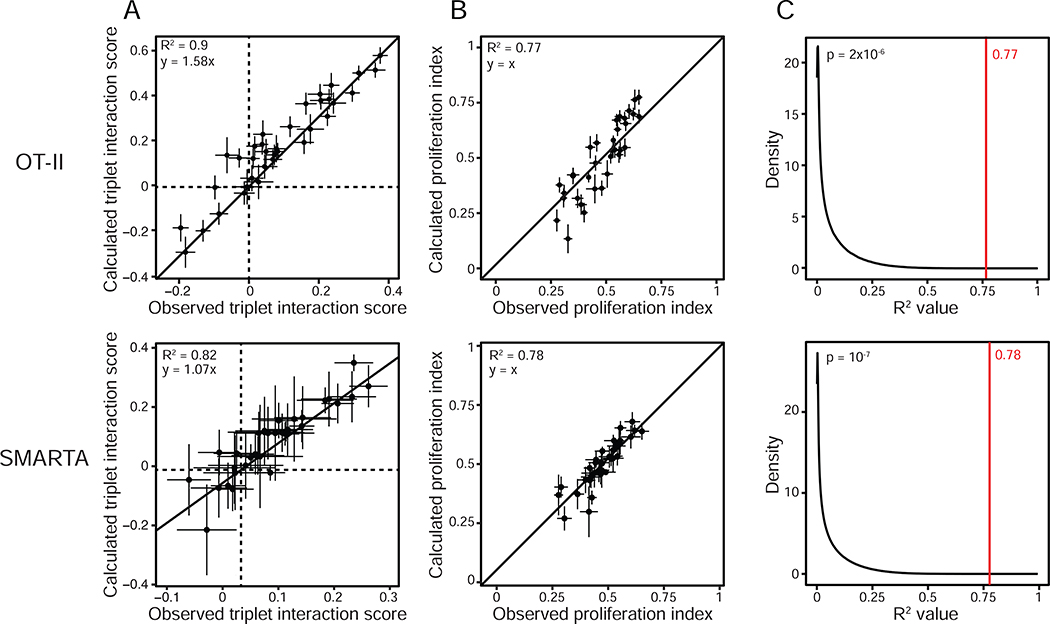
Figure 3. Single and pairwise stimulations predict higher-order effects.
(A) Dot plots of the observed (X axis) and calculated (Y axis) triplet interaction scores for all 35 ligand triplets tested and using CD4+ T cells from OT-II (top) or SMARTA (bottom) transgenic mice. Dashed lines indicate the X and Y axes. The solid line indicates a linear model fit (top, y = 1.58x; bottom, y = 1.07x). Error bars, SEM (n = 8 for OT-II and n = 2 for SMARTA).
(B) Dot plots of the observed (X axis) and calculated (based on the Isserlis formula; Y axis) triplet proliferation index values for all 35 ligand triplets tested, using OT-II (top) or SMARTA (bottom) T cells. The solid line indicates y = x. Error bars, SEM (n = 8 for OT-II and n = 2 for SMARTA).
(C) Distribution of R2 values obtained between observed and calculated proliferation indices for ligand triplets with random shuffling by bootstrapping (black line) or without (red line). The number in red indicates the R2 value obtained by correlating experimental and calculated triplet proliferation indices as shown in B. Data obtained with OT-II (top) and SMARTA (bottom) T cells.

