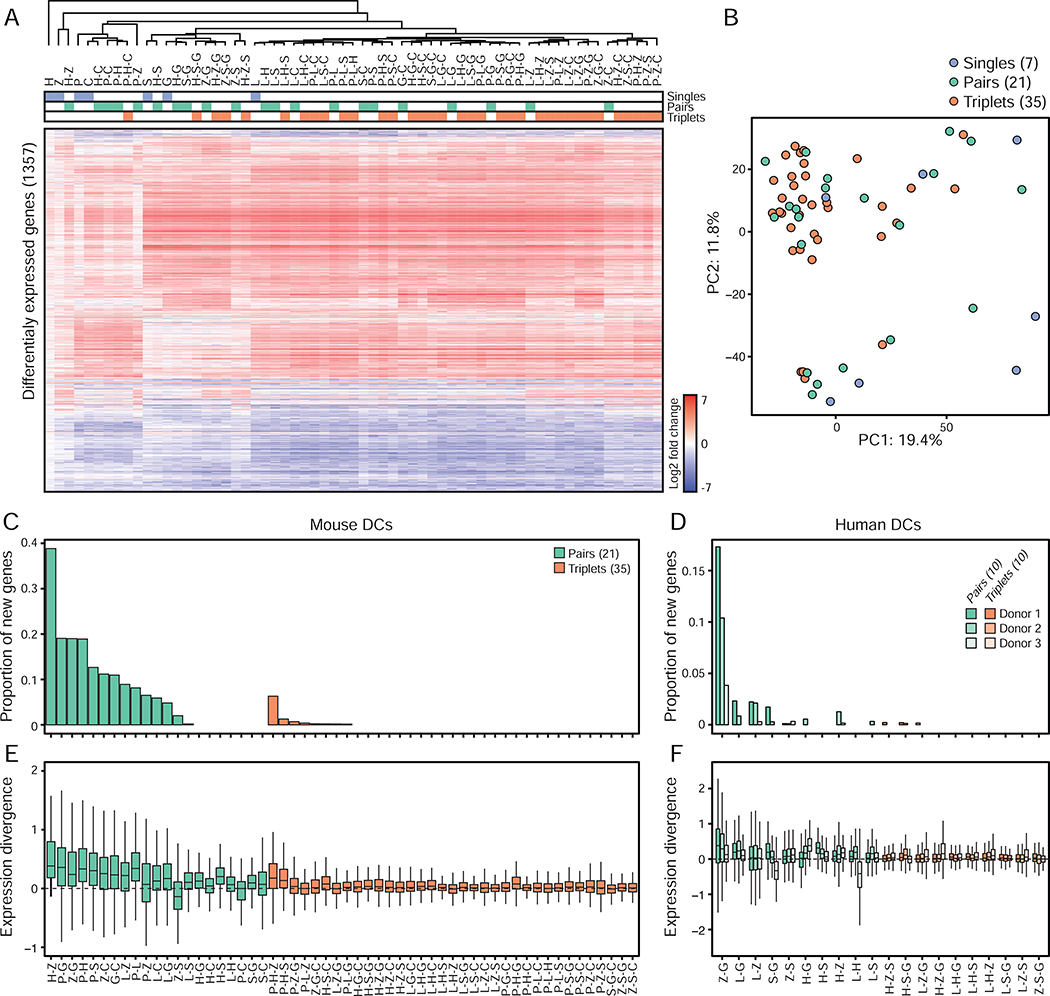
Figure 4. Single and pairwise stimulations dictate the information signaled by triplets in mouse and human DCs.
(A) Heatmap of differentially expressed genes (1,357 in total; rows) from mRNA profiles of mouse DCs stimulated with ligand singles (blue), pairs (green) or triplets (orange) (columns). Values are log2 fold-changes relative to unstimulated cells (FDR-adjusted p value < 0.01; n = 3). Hierarchical tree is based clustering using Pearson’s correlation.
(B) Principal component analysis (PCA) of mRNA profiles of mouse DCs stimulated with ligand singles (7; blue), pairs (21; green) or triplets (35; orange).
(C-D) Bar plots showing for each ligand pair (green) or triplet (orange) the proportion of genes regulated by a triplet or a pair but not by matching composite singles and/or pairs relative to the total number of genes regulated by that triplet, using mouse (C) and human (D) DCs (n = 3).
(E-F) Box plots showing the smallest divergences between the level of expression of genes regulated by ligand pairs (green) and triplets (orange) and their composite singles and/or pairs, using mouse (E) and human (F) DCs (n = 3). Box plots represent the median, first quartile and third quartile with lines extending to the furthest value within 1.5 of the interquartile range (IQR).
See also Figures S5–6 and Tables S2–3.

