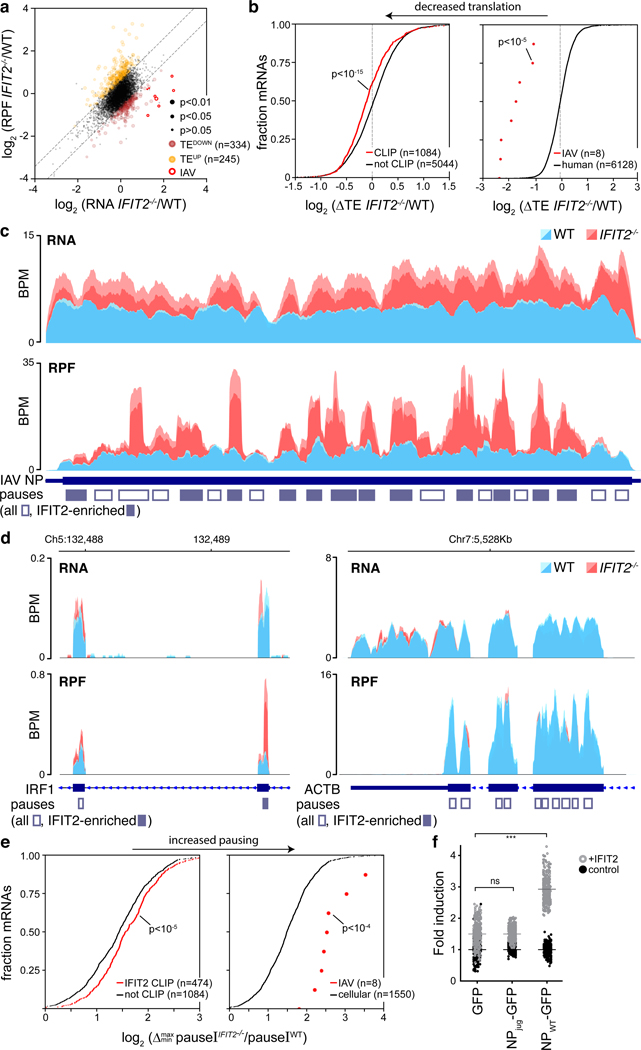
Figure 5. IFIT2 modulates translational efficiency by preventing ribosome pausing.
Differentially translated mRNAs were identified by ribosome profiling of IAV WSN-infected WT and IFIT2−/− A549 cells. a, The relative contribution of transcription and translational were assessed by plotting fold changes between IFIT2−/− and WT cells for input RNA versus ribosome protected fragments (RPF) from each transcript. Dotted lines represent a 1.5-fold (log2 0.58) threshold. Transcripts that are differentially translated in IFIT2−/− cells have been colored, with IAV mRNAs highlighted. p values derived from a two-sided F-test (see Supplemental Table 4). b, The translational efficiency of all IFIT2-bound mRNAs (left) or viral mRNAs (right) is decreased in the absence of IFIT2. Bound transcripts were compared to unbound transcripts via a Mann-Whitney U-test. c-d, Accumulation of paused ribosomes in the absence of IFIT2. Normalized read density for total RNA (top) and RPFs (bottom) mapping to IFIT2-bound NP (c) and IRF1 (d, left) or unbound β-actin (d, right) mRNAs in infected WT and IFIT2−/− cells. Data from replicate experiments are plotted as mean and standard deviation using dark and light shades of the same color, respectively. Pause sites are shown below. Pause sites enriched in IFIT2−/− cells >1.5-fold are filled in. BPM = bins per million. e, Ribosome pausing increases during infection of IFIT2−/− cell. Changes in pause intensity (pauseI) at the maximum and minimum pauseI sites on each transcript were calculated during infection of WT and IFIT2−/− cells. All IFIT2-bound mRNAs (left) or viral mRNAs (right) were compared to remaining transcripts via a two-sided Mann-Whitney U-test. f, Sequence-dependent enhancement of NP translation in the presence of IFIT2 or control. NP was encoded as a GFP polyprotein using WT or juggled codons. Expression was quantified by fluorescence imaging of live cells. n = 2 biological replicates quantifying 177 fields of view each. IFIT2 induction of NP-GFP variants was compared to the GFP-only control using a one-way ANOVA with post hoc Tukey’s HSD (*** p < 0.001).

