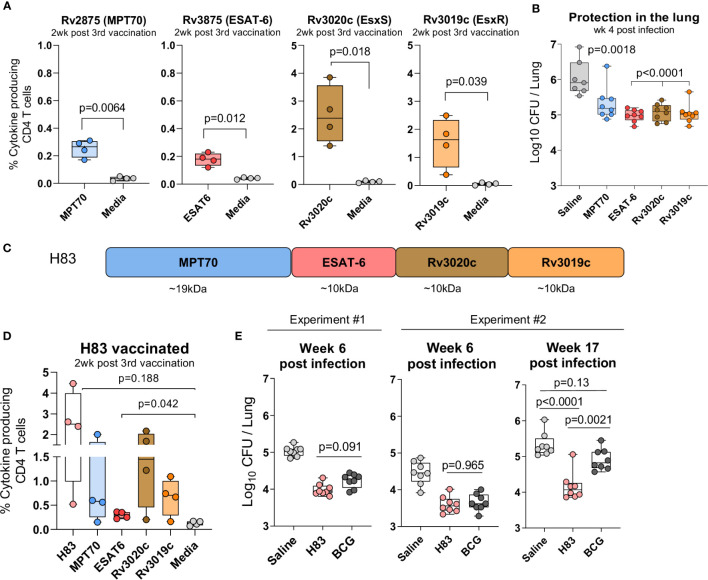
Figure 2.
H83, a fusion protein of immunodominant antigens, confer robust long-term protection. Female CB6F1 mice were vaccinated with 10 µg of either MPT70, ESAT-6, Rv3020c, Rv3019c, or Tris-HCL buffer three times s.c. at the base of the tail. (A) Immunogenicity of single antigens were assessed two weeks after 3rd immunization by stimulating splenocytes in vitro with individual antigens or media. Figures represent percentage of cytokine producing (TNFα and/or IFN-y and/or IL-2) CD4 T cells after intracellular cytokine staining (ICS) (n = 4). The gating strategy for antigen-specific CD4 T cells is shown in Supplementary Figure 1 . Paired t-test, two-tailed, t-values (6.84, 5.52, 4.71, 3.51, df = 3). (B) Vaccine-mediated protection were determined by counting the bacterial numbers in the lungs of MPT70-, ESAT-6-, Rv3020c-, and Rv3019c-vaccinated mice at week 4 post Mtb Erdman infection (n = 7–8). Colony forming units (CFUs) for one saline mouse was too numerus to count. One-way ANOVA with Tukey’s multiple comparison test, F-value (5, 41) = 41.59. (C) The fusion protein, hybrid 83 (H83), was composed of MPT70, ESAT-6, Rv3020c, and Rv3019c in the mentioned order. (D) Percentage of cytokine-producing CD4 T cells after H83 vaccination measured by ICS. Splenocytes were restimulated with H83, MPT70, ESAT-6, Rv3020c, Rv3019c, or media two weeks after 3rd immunization (n = 4). Brown-Forsythe and Welch ANOVA tests with Dunnett’s multiple comparison test, F-value (5.000, 6.606) = 4.351, W-value (5.000, 7.664) =5.975. (E) CB6F1 mice were vaccinated with 2 µg H83 three times or once with 2x10⁵ CFU BCG Danish. Six weeks after 3rd subunit vaccination or ten weeks after BCG immunization, mice were challenged with Mtb. Bacterial numbers were determined in the lungs of H83- and BCG-vaccinated mice in two individual experiments at week 6 and one experiment at week 17 post Mtb infection (n = 8). One-way ANOVA with Tukey’s multiple comparison test was performed, and the exact p-values indicated, F-values (3, 28) = 44.02, 23.07, 21.26. Data shows box plots with whiskers indicating minimum and maximum values.

