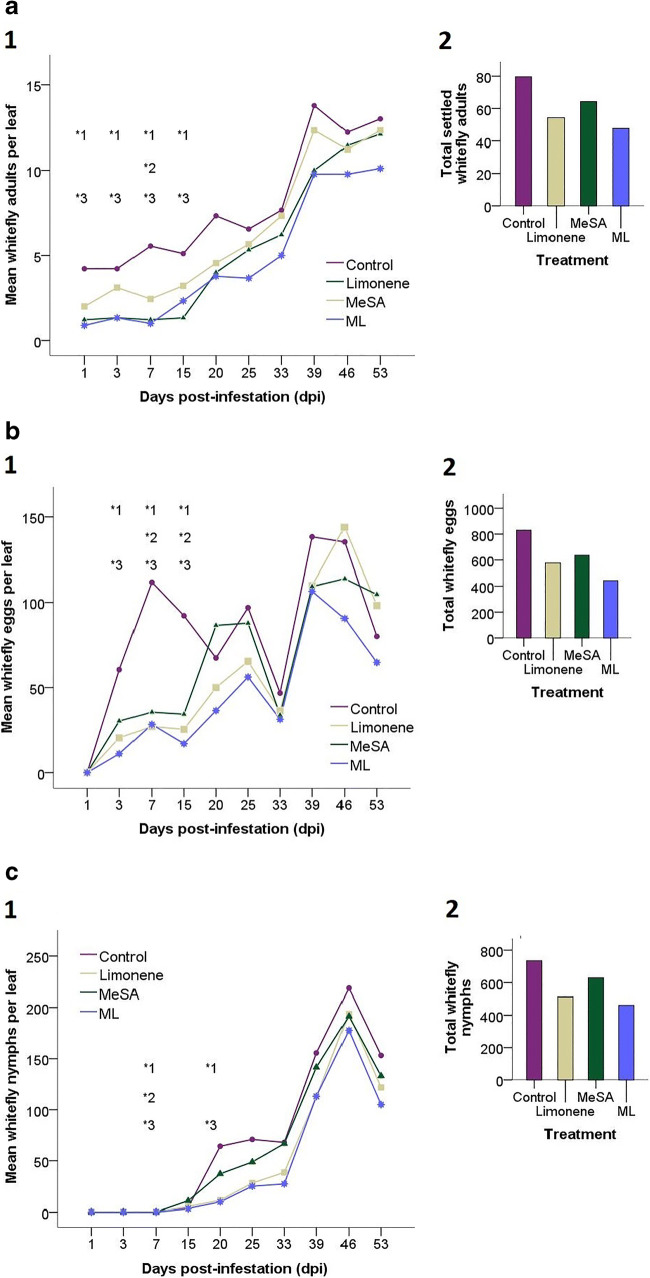
Fig. 2.
Population development of whiteflies on tomato at all life cycle stages (Settling adults = A, Eggs = B and Nymphs = C) is expressed as average whitefly per leaf (n = 9) across the following treatments: Control = Light grey, Limonene = light blue, MeSA = grey and ML = dark blue. Data were (log+1) transformed and analysed using repeated measures ANOVA’s with Tukey HSD post-hoc tests to compare treatments at individual sampling points (days post infestation (dpi)). Significant observations at individual sampling points are annotated onto the graphs above the sampling point to which this corresponds. The superscript numbers accompanying each significance measure indicate which two treatments are being compared. 1 = Control vs Limonene, 2 = Control vs MeSA and 3 = Control vs ML. (A1) shows the average number of settling whitefly adults per leaf, there was no significant effect of treatment * time but there was a significant effect of treatment following repeated measures ANOVA’s. Post-hoc comparisons revealed there were significantly less whiteflies on Limonene and ML plots at 1, 3, 7, and 15, whereas there were significantly less whiteflies on MeSA plots only at 7dpi. There were also significantly less whiteflies on Limonene plots compared with MeSA plots at 15 dpi. (A2) shows the cumulative total of adult whiteflies counted as settled on sampled leaves over the course of the whole experiment, in order to display trends across the whole growing season. (B1) Shows the average eggs laid per leaf, there was no significant effect of treatment * time, but there was a significant effect between treatments following repeated measures ANOVAs. Limonene and ML treatments had significantly less eggs than control plots at 3dpi, 7dpi and 15dpi. MeSA plots had significantly less eggs than control plots at 7dpi and 15dpi. (B2) shows the cumulative total of whitefly eggs counted on sampled leaves over the course of the whole experiment, in order to display trends across the whole growing season. (C1) Shows the average nymphs (all larval stages) per leaf, there was a significant effect of treatment * time and a significant effect between treatments following repeated measures ANOVA’s. There were significantly less nymphs on all treated plots at 7dpi. At 20 dpi there were significantly less nymphs on Limonene and ML plots compared with controls and significantly less nymphs on ML plots compared with MeSA. (C2) shows the cumulative total of whitefly nymphs counted on sampled leaves over the course of the whole experiment, in order to display trends across the whole growing season. Ninety five percent confidence intervals have been calculated and are available in the supporting information (SI raw data 1), but to aid visualisation they have been removed from the figure

