
Fig. 5. Event-related magnetic field (ERMF) distributions and current density reconstructions (CDR) of the Pd component.
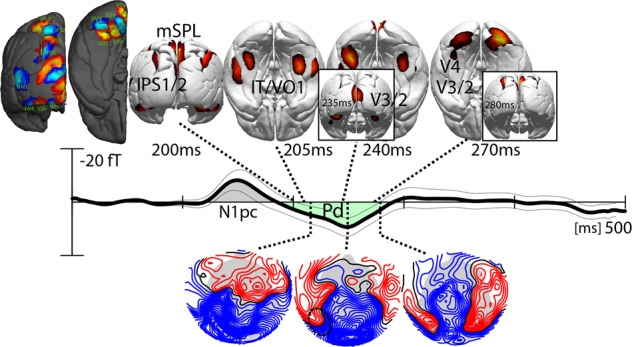
The CDR maps show activity above an arbitrary threshold to illustrate the source maxima at representative time points after stimulus onset. The waveform in the replots the hemisphere-collapsed dERL response shown in Fig. 2. The ERMF maps show successive field distribution in the Pd time range. The field lines (blue/red) separated by increments of 2fT. The hot-scale and blue-scale areas rendered onto the dark gray hemispheres display probabilistic maps of retinotopic areas (see “Methods”).