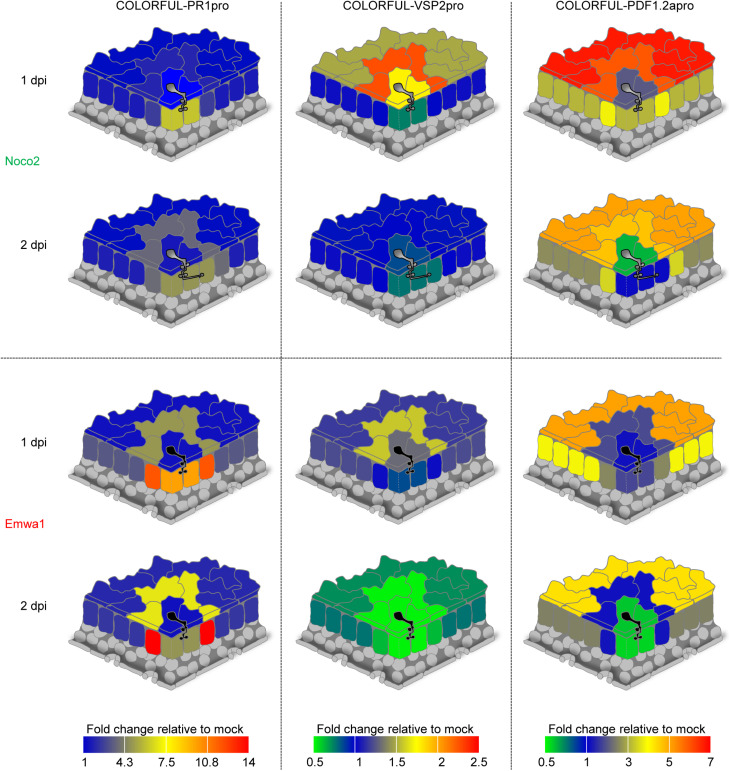
FIGURE 5.
Spatio-temporal signatures of SA, JA, and JA/ET signaling activities at sites of A. thaliana-H. arabidopsidis interactions. Quantitative heat map representations of COLORFUL-PR1pro (left), COLORFUL-VSP2pro (middle), and COLORFUL-PDF1.2apro (right) reporter activities in leaves of 3-week-old A. thaliana lines COLORFUL-PR1pro#1, -VSP2pro#1 and -PDF1.2apro#1, respectively, at 1 (top) and 2 (bottom) day(s) post inoculation (dpi) with virulent (Noco2; uppermost two schemes) and avirulent (Emwa1; lowermost two schemes) isolates of H. arabidopsidis (see also Supplementary Figure S7).

