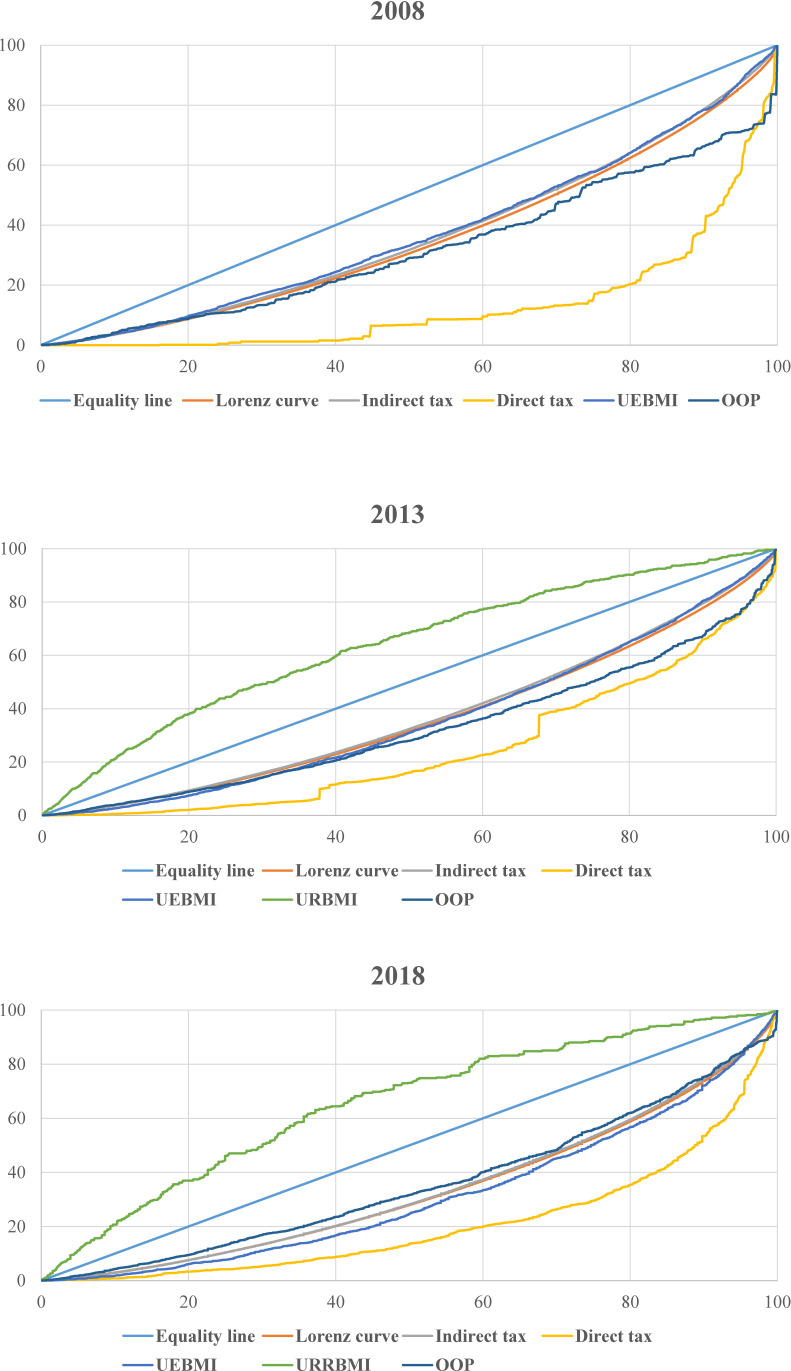
Figure 2.
Concentration curve of healthcare payments and Lorenz curve in urban areas. The figure shows actual cumulative concentration curves for healthcare payments (including those associated with indirect taxes, direct tax, UEBMI, URBMI, URRBMI and OOP payments) and the Lorenz curve in urban areas in 2008, 2013 and 2018. OOP, out of pocket; UEBMI, Urban Employee Basic Medical Insurance; URBMI, Urban Resident Basic Medical Insurance; URRBMI, Urban and Rural Resident Basic Medical Insurance.

