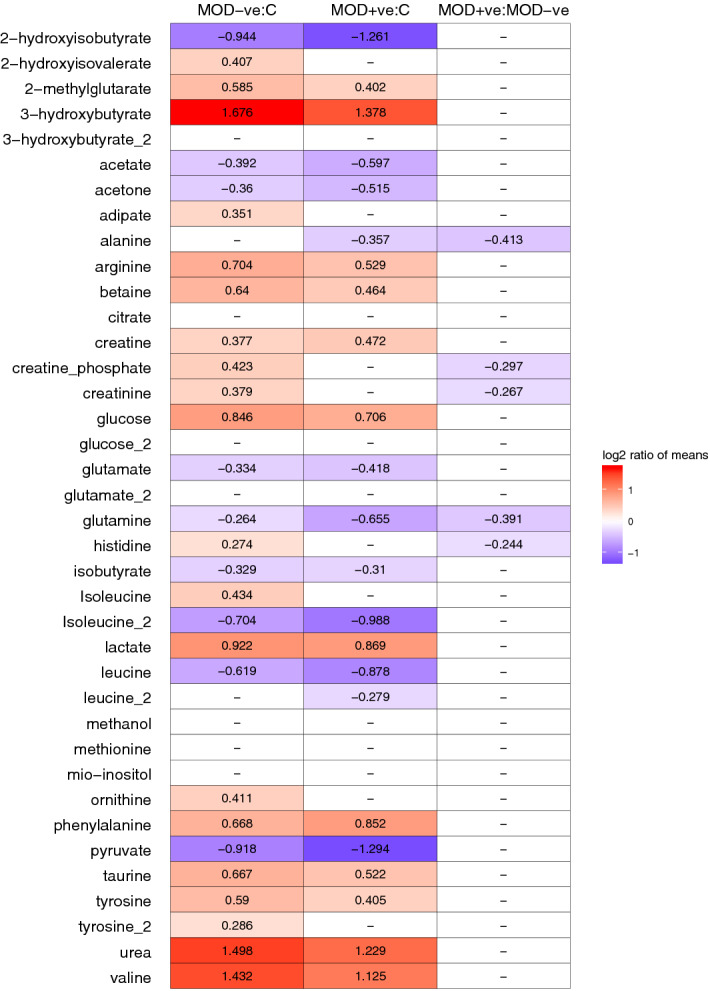
Figure 4.

Comparison of metabolic profiles for MOD, no MOD and control cohorts. (a) Metabolite abundance comparison. Each comparison is shown in column (C—control, Yes—multiple organ dysfunction, No—no multiple organ dysfunction). The numbers and colours denote log ratio of group means in statistically significant comparisons only (t test, alpha = 0.05). Mean log ratios of MOD-positive and MOD negative group metabolic profiles with controls.
