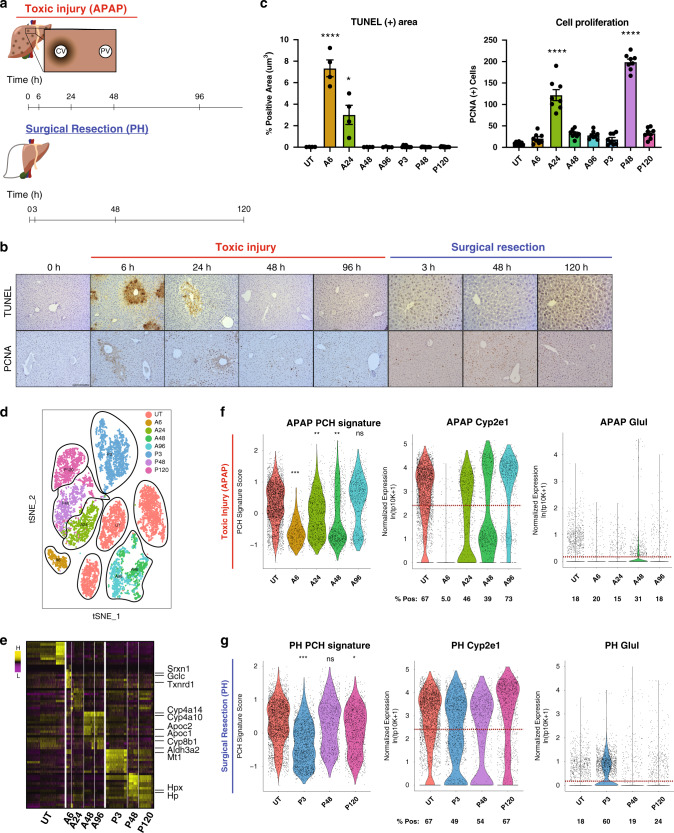
Fig. 1. Hepatocyte response to toxic and surgical liver injuries.
a Time course depicting analysis time points during liver injury recovery following APAP overdose or PH. b Murine liver sections (5 μm, n = 3) show necrotic TUNEL-positive (brown, top) and proliferative PCNA-positive (brown, bottom) cells. Scale bar is 100 μm. c Bar graphs quantifying total TUNEL- and PCNA-positive area. Error bars are s.e.m., P < 0.05 (*), < 0.01 (**), and < 0.0001 (****) calculated using unpaired t test with Welch’s correction (two-tailed). d t-SNE plot of all high-quality hepatocytes (Methods) in the scRNA-Seq dataset. Cells are colored by injury mode and time point. SNN clusters outlined in black. e Heatmap of marker genes for all clusters outlined in (d). f, g Pericentral Hepatocyte Signature Score (PCH Signature Score) (left). Violin plot of normalized expression of Cyp2e1 (middle) and Glul (right); percent positive calculated as percentage of total cells in each condition above average normalized genes expression (dashed red line). Untreated (UT) and each post-treatment are plotted for APAP (f) and PH (g). Source data provided as a Source Data file.

